

Transaction Analytics
Overview
The Transaction Analytics module provides comprehensive insights and monitoring capabilities for all transaction data processed through the Juspay payment platform. It offers real-time and historical analysis of transaction performance, success rates, processing times, and detailed breakdowns across various business dimensions with multiple viewing modes for different analytical perspectives.
This module is designed for a wide range of users, including:
Operations Teams: For monitoring transaction processing performance and identifying bottlenecks across different payment methods and gateways.
Finance Teams: For tracking transaction volumes, success rates, revenue analysis, and financial impact assessment across multiple currencies.
Customer Support: To investigate transaction issues, analyze customer behavior patterns, and provide accurate status updates to customers.
Accessing the Module
Log in to the Juspay dashboard.
From the main navigation menu on the left, click on Payments.
Select Transaction Analytics from the Payments submenu.
The navigation URL for this module is https://portal.juspay.in/analytics-transactions
 .
.
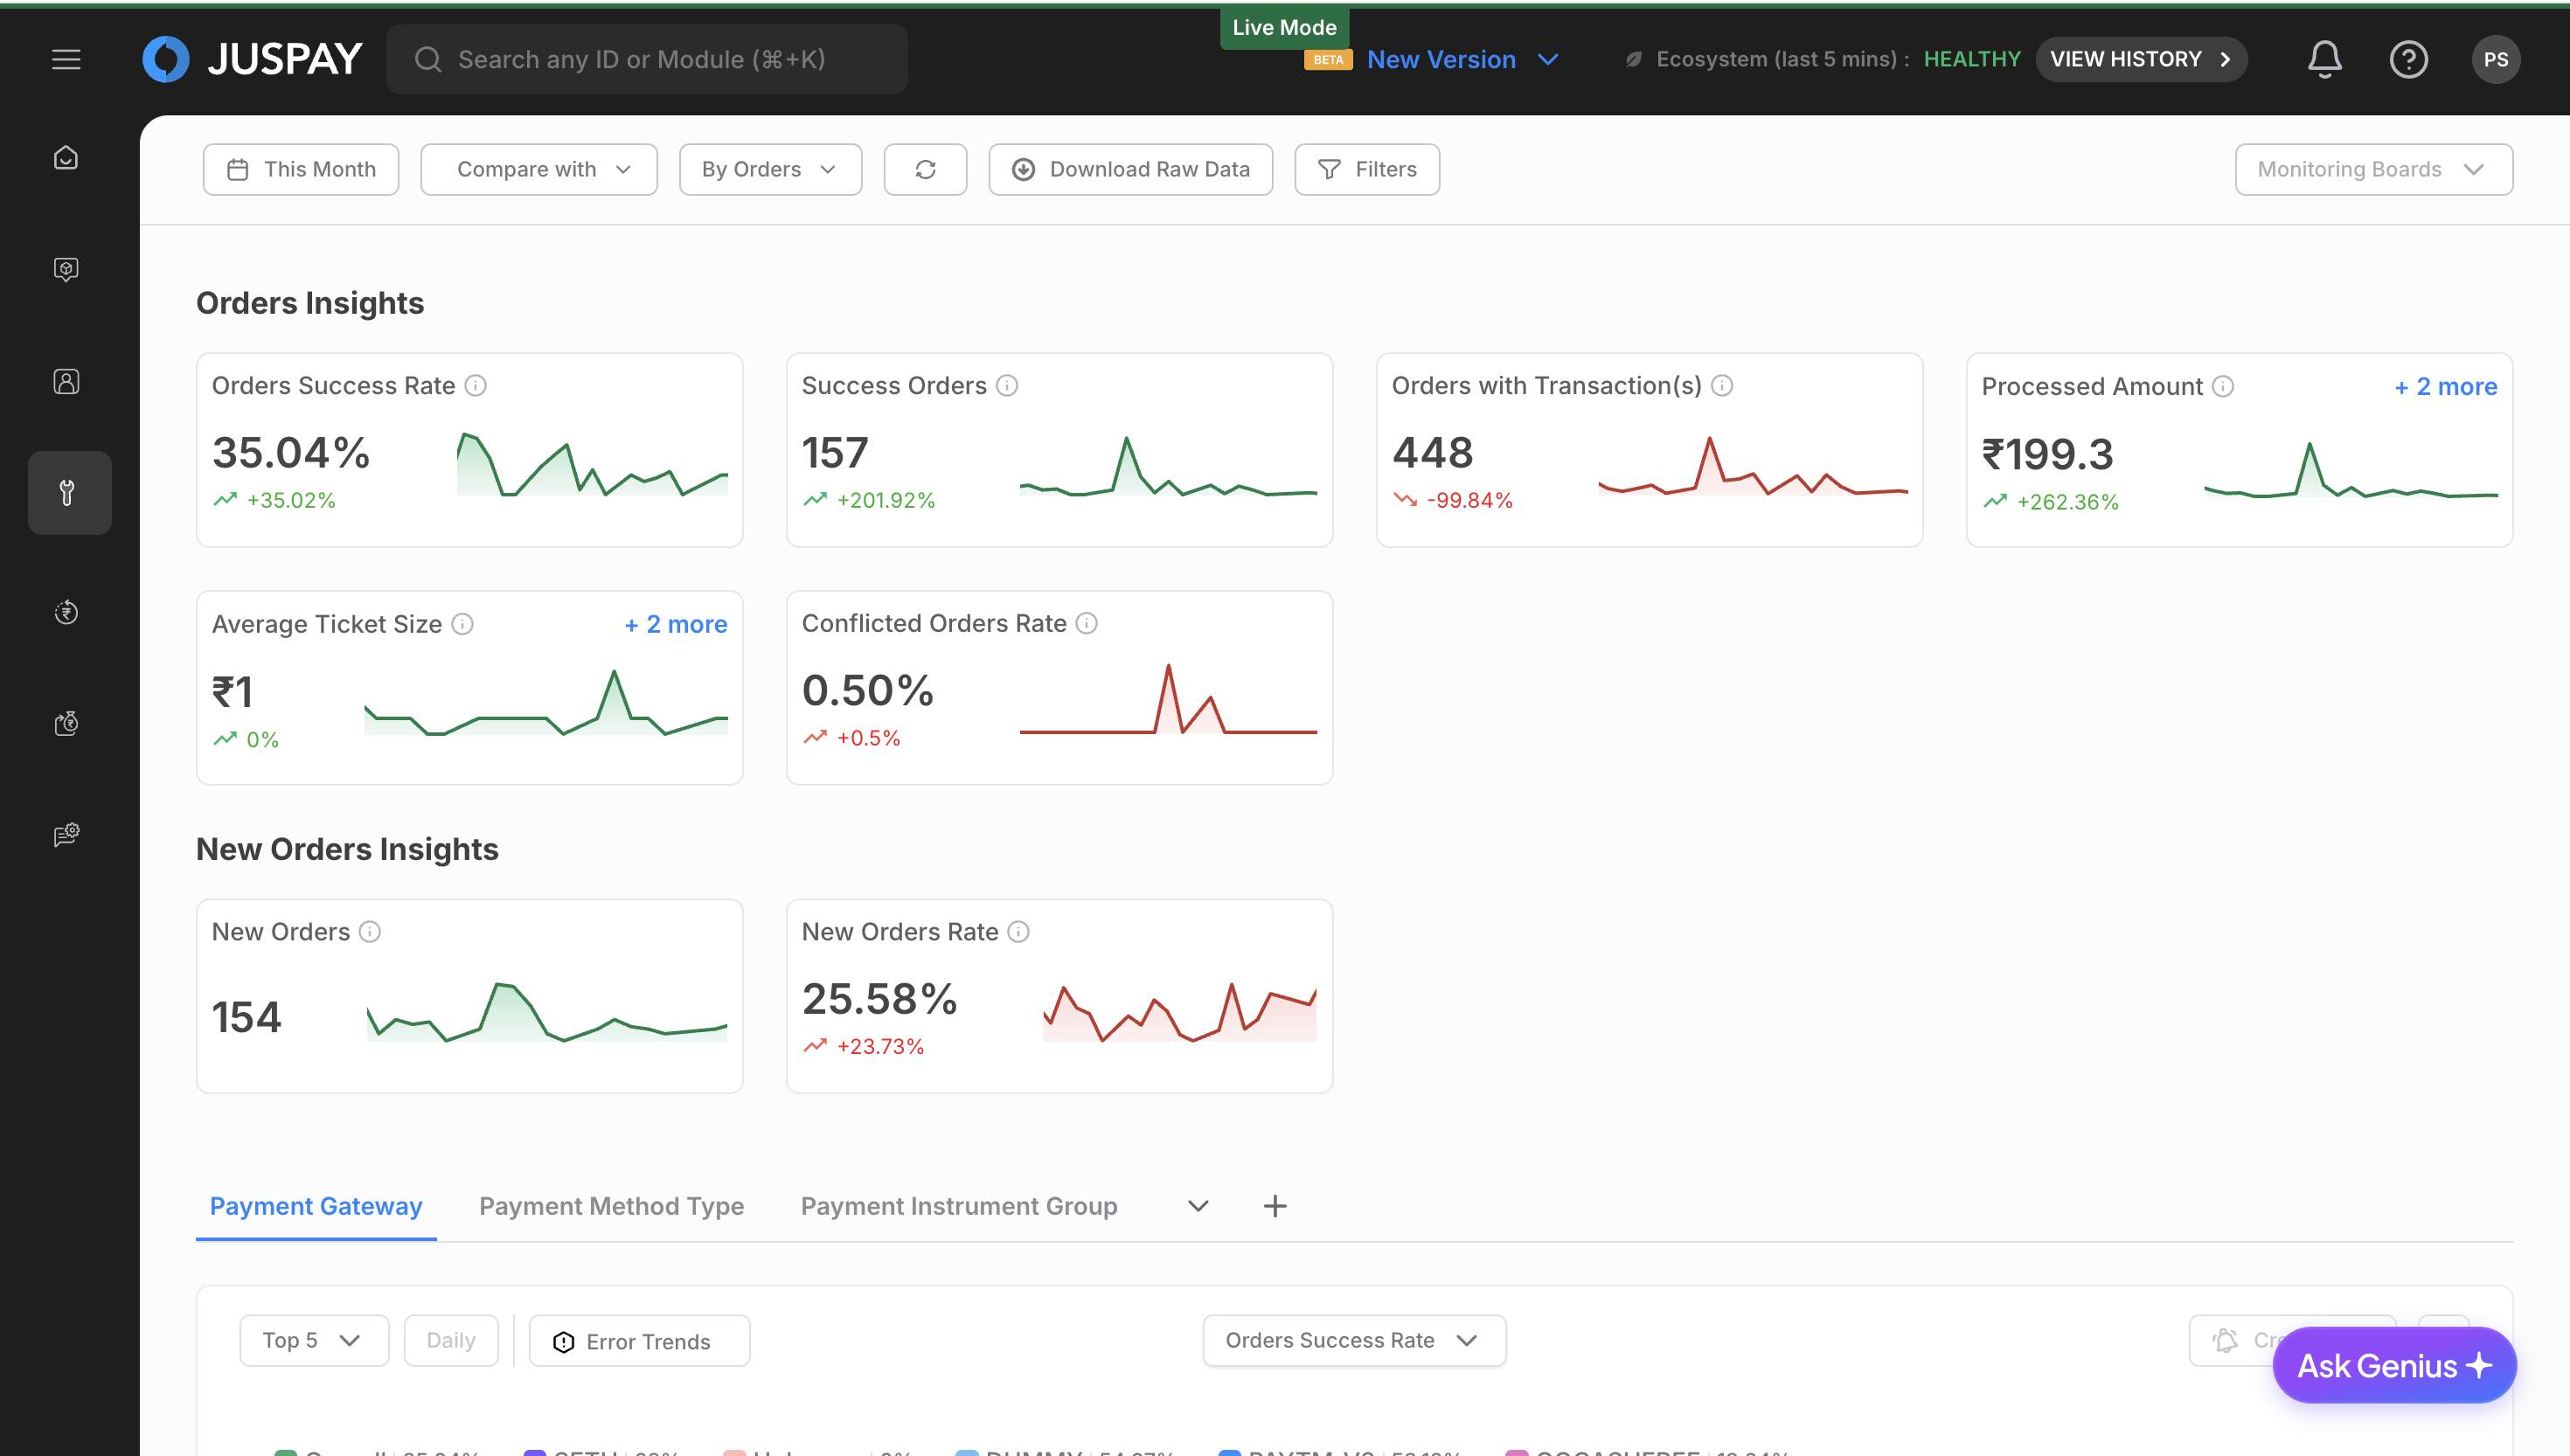
Dashboard Overview
Viewing Modes
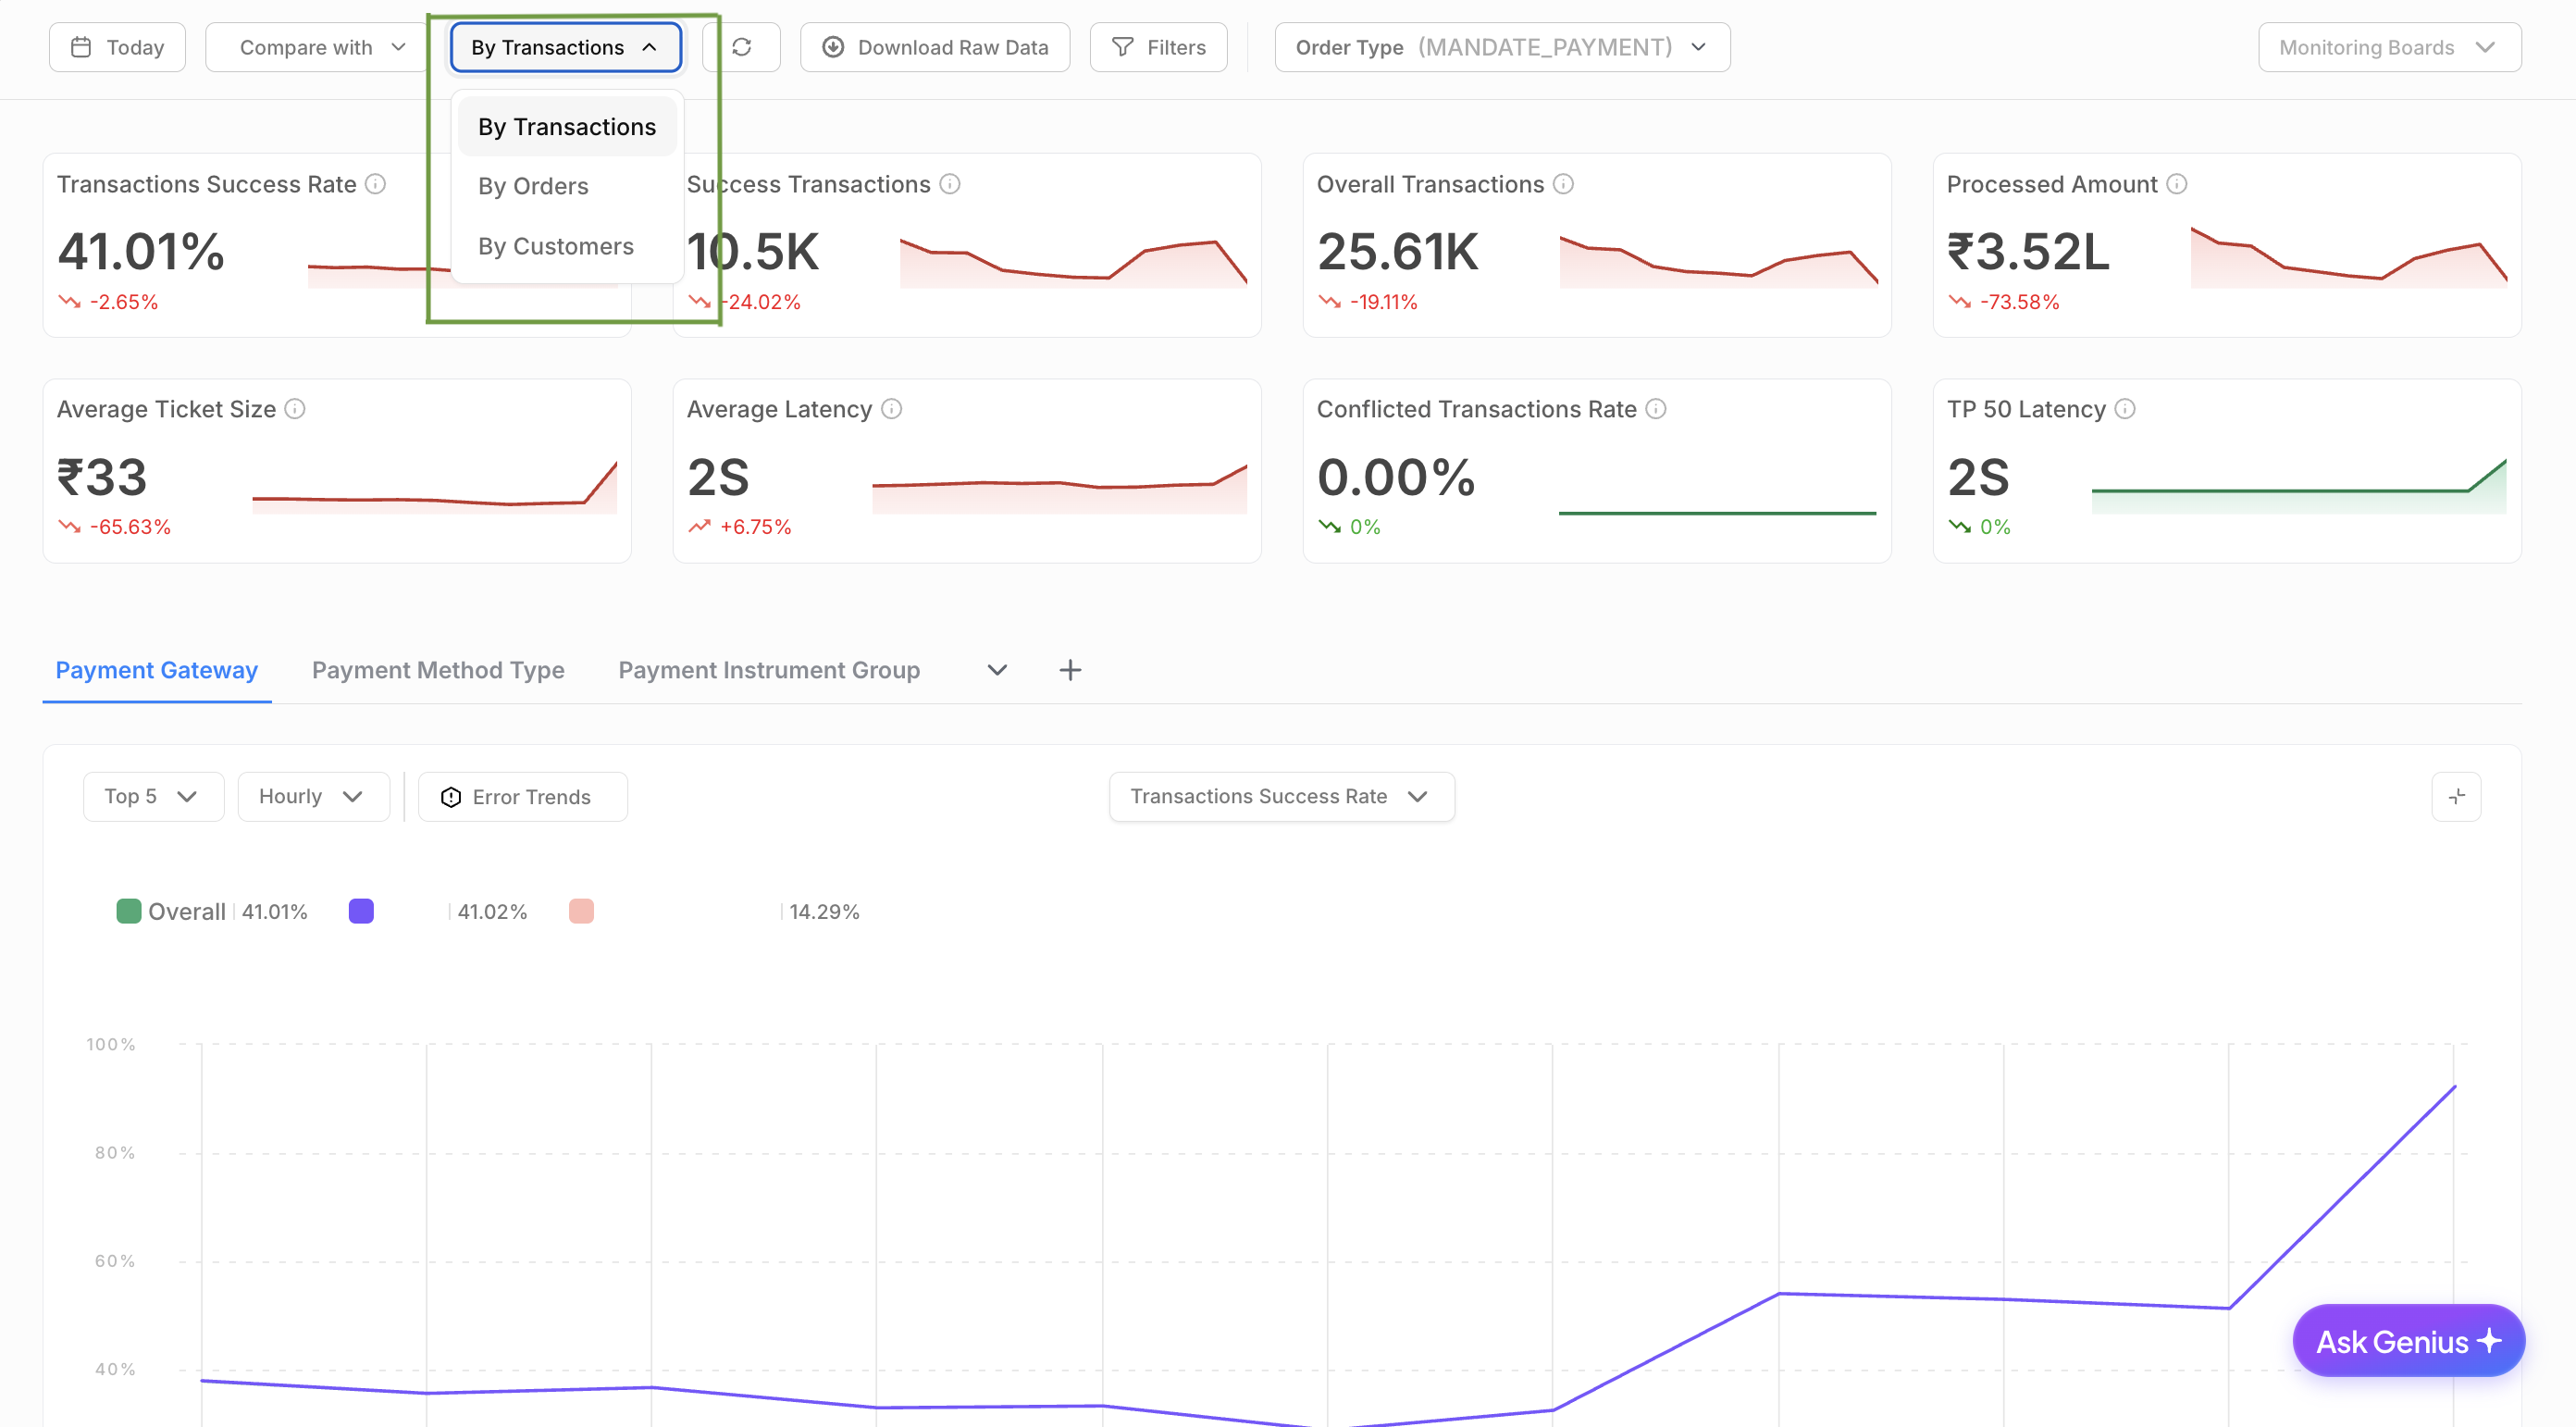
The Transaction Analytics module offers three distinct viewing modes, each providing different analytical perspectives:
TXN Mode (Transaction Level)
Purpose: Analyzes individual transaction data with detailed transaction-level insights
Use Case: Best for investigating specific transaction issues, payment method performance, and detailed transaction flow analysis
Data Granularity: One row per transaction in downloads
Metrics Focus: Transaction success rates, processing times, error analysis, and payment method effectiveness
ORDER Mode (Order Level)
Purpose: Analyzes order-level data with aggregated transaction information
Use Case: Ideal for business analysis, order completion rates, and customer purchase behavior
Data Granularity: One row per order with aggregated transaction information in downloads
Metrics Focus: Order completion rates, average order values, customer conversion analysis
NEW Feature: Order-level downloads now provide aggregated order data instead of transaction details
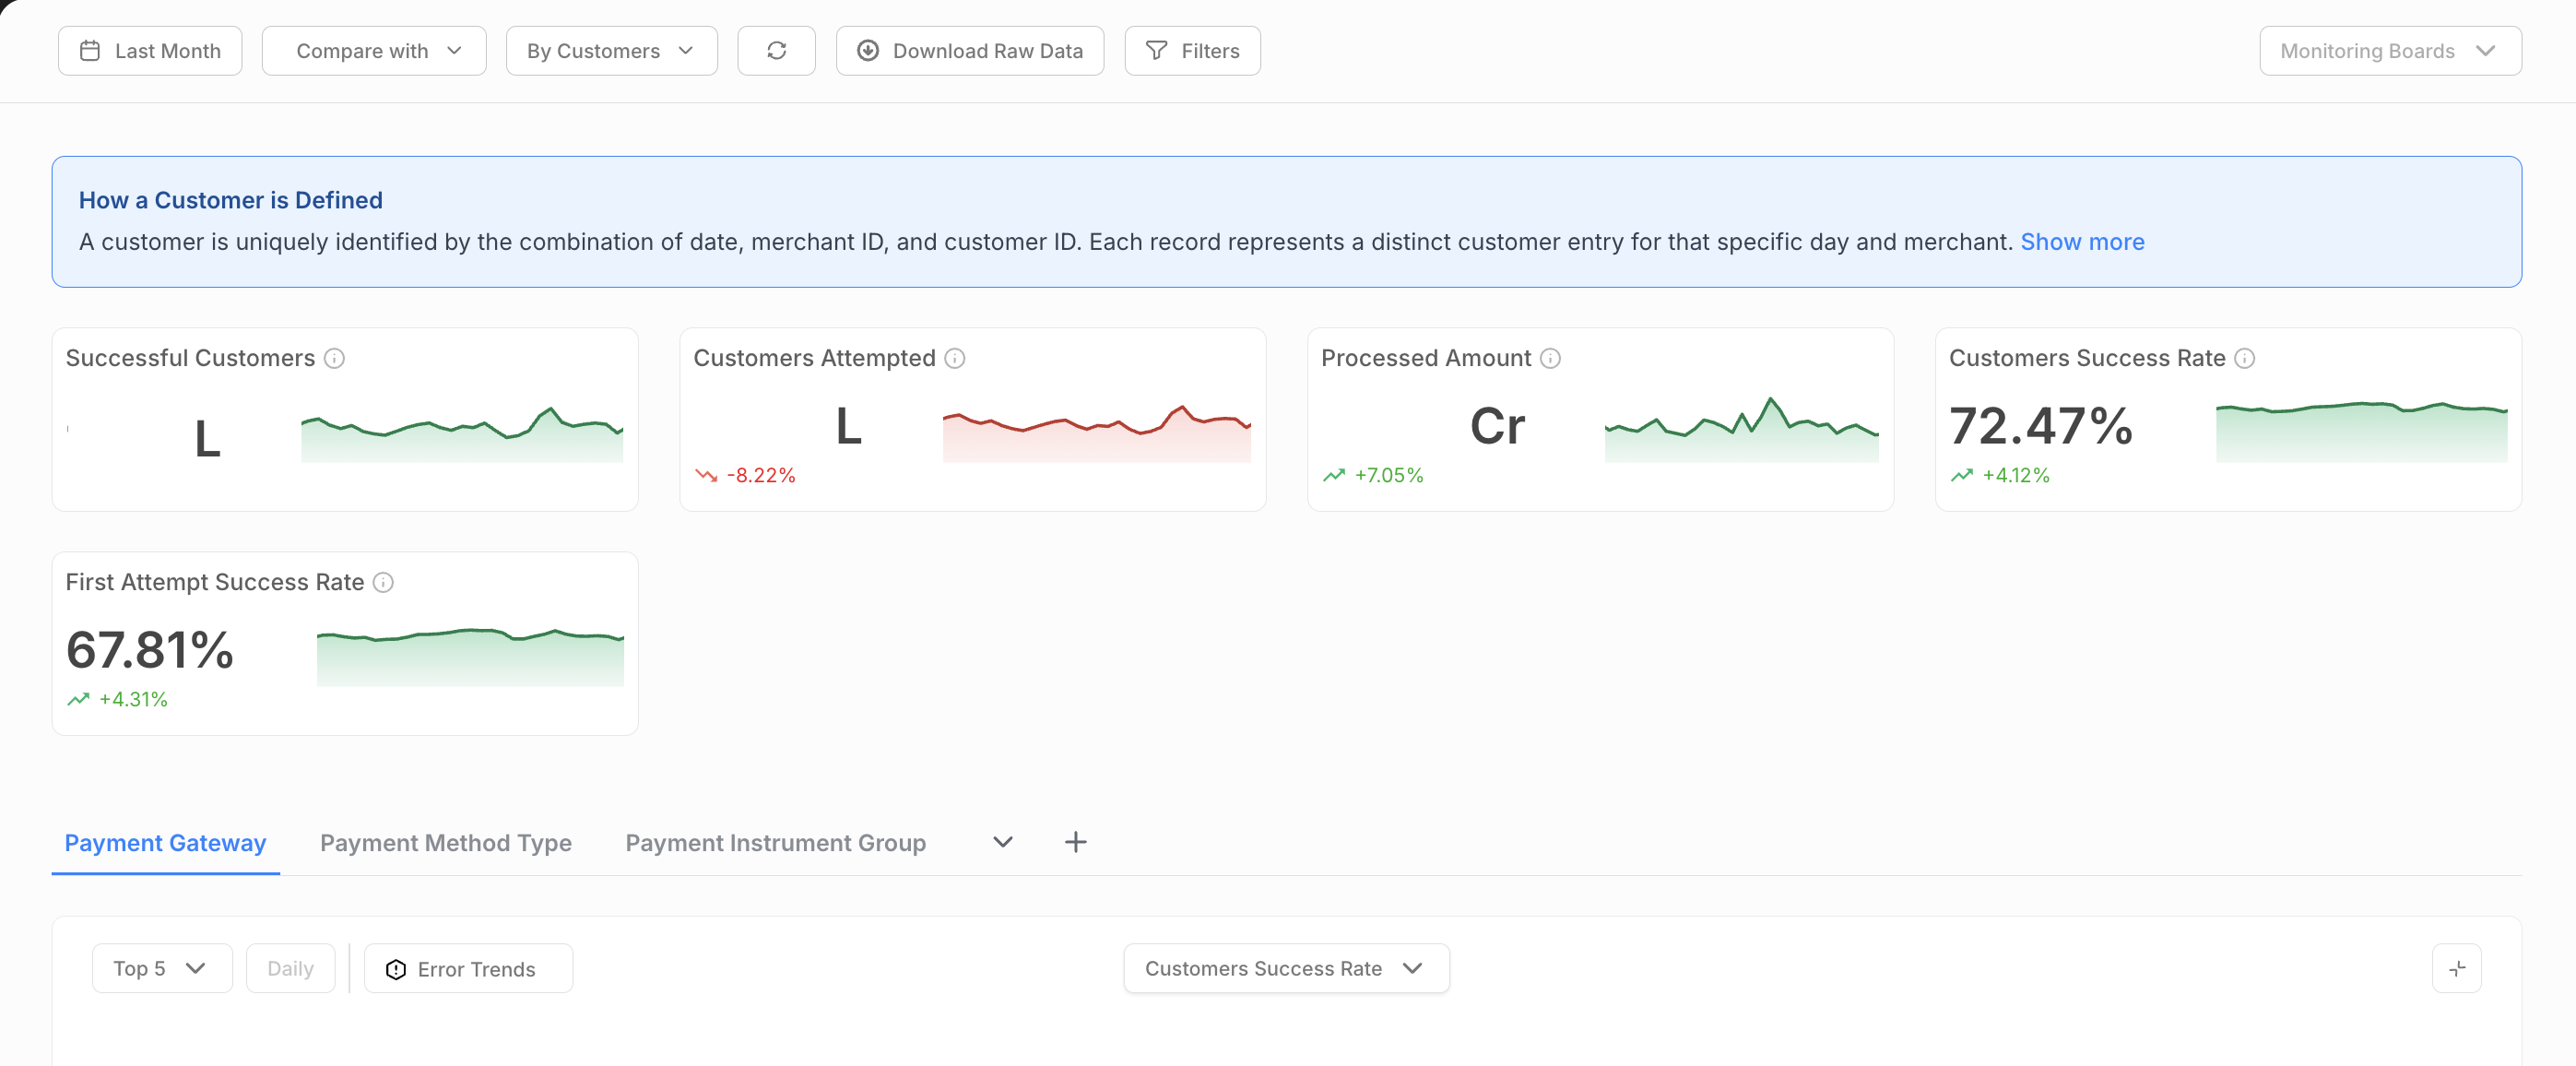
CUSTOMER Mode (Customer Level)
Purpose: Analyzes customer-level data and behavior patterns
Use Case: Perfect for customer segmentation, retention analysis, and customer lifetime value assessment
Data Availability: Limited to past 24 hours and dates after April 1st, 2025
Customer Definition: A customer is uniquely identified by the combination of date, merchant ID, and customer ID. Each record represents a distinct customer entry for that specific day and merchant.
Example: If customer ID 'C123' makes 3 transactions with merchant 'M456' on Jan 1st, it counts as 1 unique customer for that day. If the same customer makes transactions on Jan 2nd, it counts as another unique customer entry.
Key Performance Metrics
The dashboard displays essential transaction performance indicators at the top, varying by selected mode:
Common Metrics Across All Modes:
Success Rate: Percentage of successful transactions/orders/customers out of total initiated
Total Volume: Total number of transactions/orders/unique customers
Total Amount: Total monetary value of successful transactions with multi-currency support
Error Rate: Percentage of failed transactions with detailed error analysis
Mode-Specific Metrics:
TXN Mode: Transaction latency percentiles, payment method success rates, gateway performance
ORDER Mode: Order completion rates, average order values, order processing times
CUSTOMER Mode: Unique customer counts, customer retention rates, customer transaction patterns
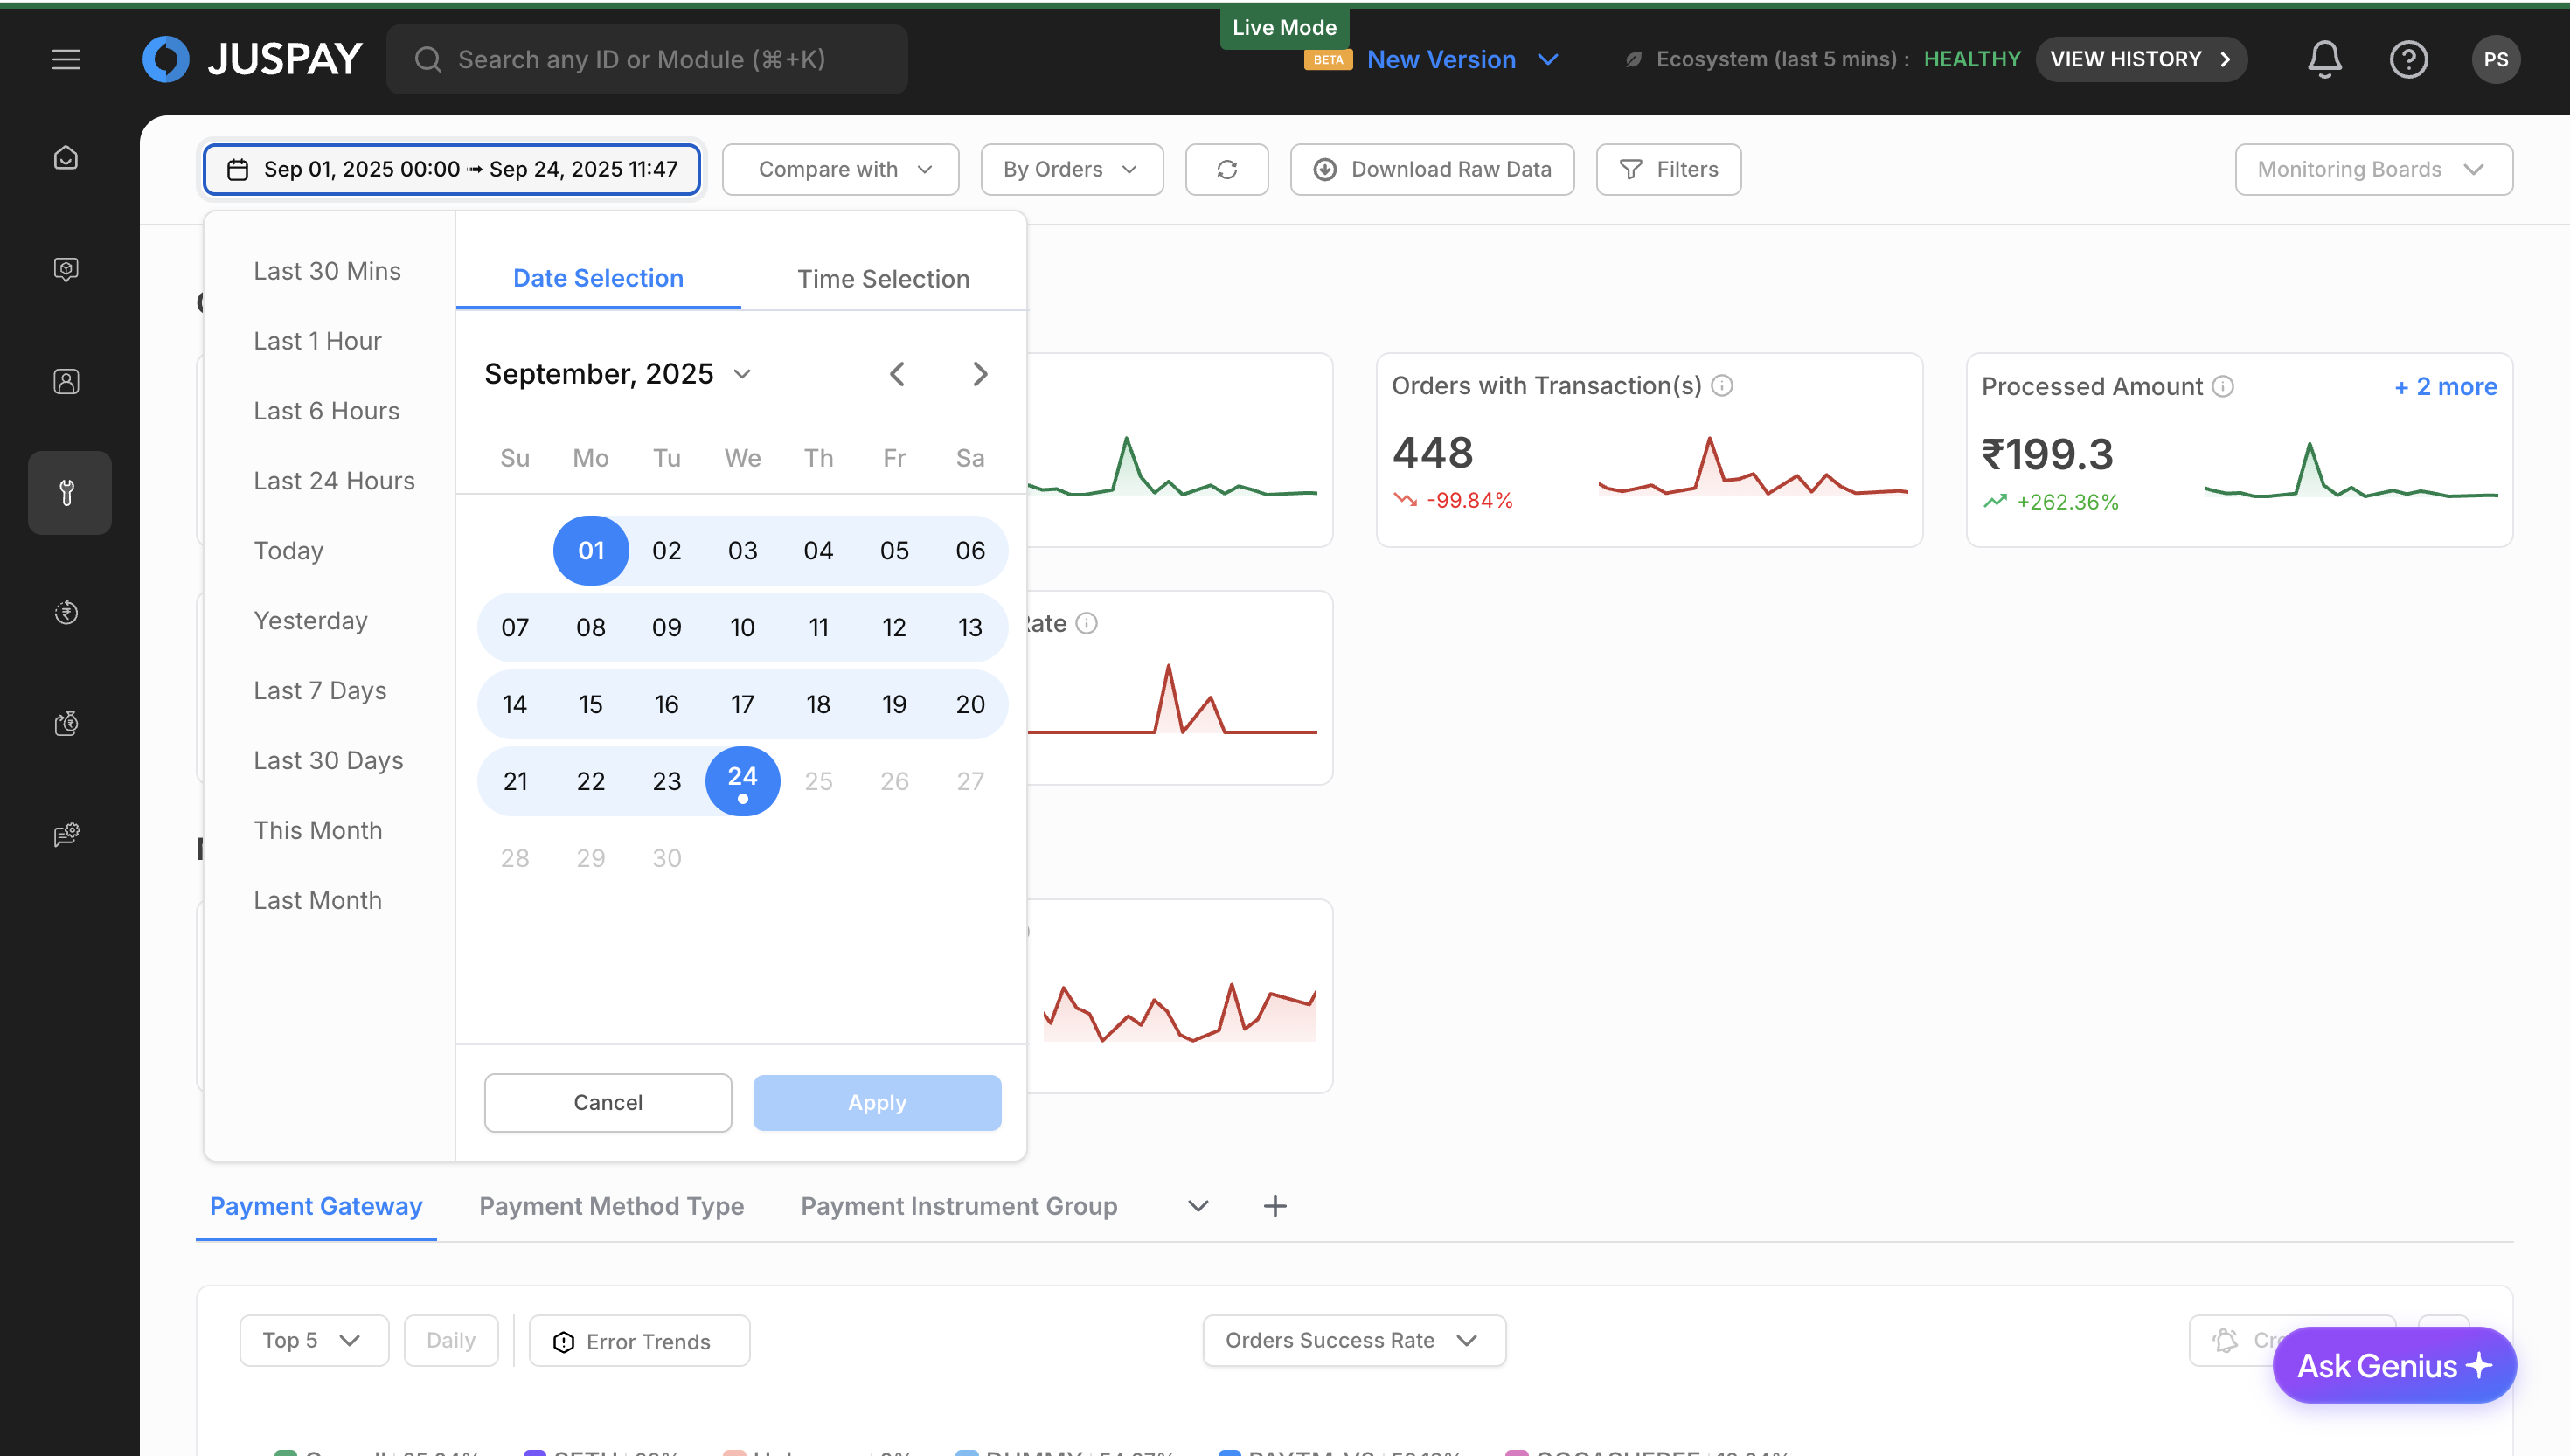
Time Range Selection
Use the date picker to select your desired time range for analysis.
The system automatically rounds times to 5-minute intervals for consistency and performance.
Choose from predefined ranges or set custom date ranges.
Click Apply to refresh all metrics and charts with the new time range.
Customer Information Banner (Customer Mode Only)
When in Customer Mode, an informational banner explains customer identification:
Expandable Information: Click "Show more" to see detailed customer definition
Customer Logic: Explains how customers are uniquely identified by date, merchant ID, and customer ID combination
Practical Example: Provides concrete examples of customer counting methodology
Filtering and Segmentation
Fixed Filters (Always Available)
Date Filter
Purpose: Select time range for analysis
Options: Predefined ranges (Today, Last 7 days, Last 30 days, etc.) or custom date selection
Mobile Optimization: Simplified date format for mobile users
Time Rounding: Automatic rounding to 5-minute intervals for performance
Mode Filter
Purpose: Switch between TXN, ORDER, and CUSTOMER analysis modes
Options: TXN (Transaction Level), ORDER (Order Level), CUSTOMER (Customer Level)
Dynamic Content: Available segments and metrics change based on selected mode
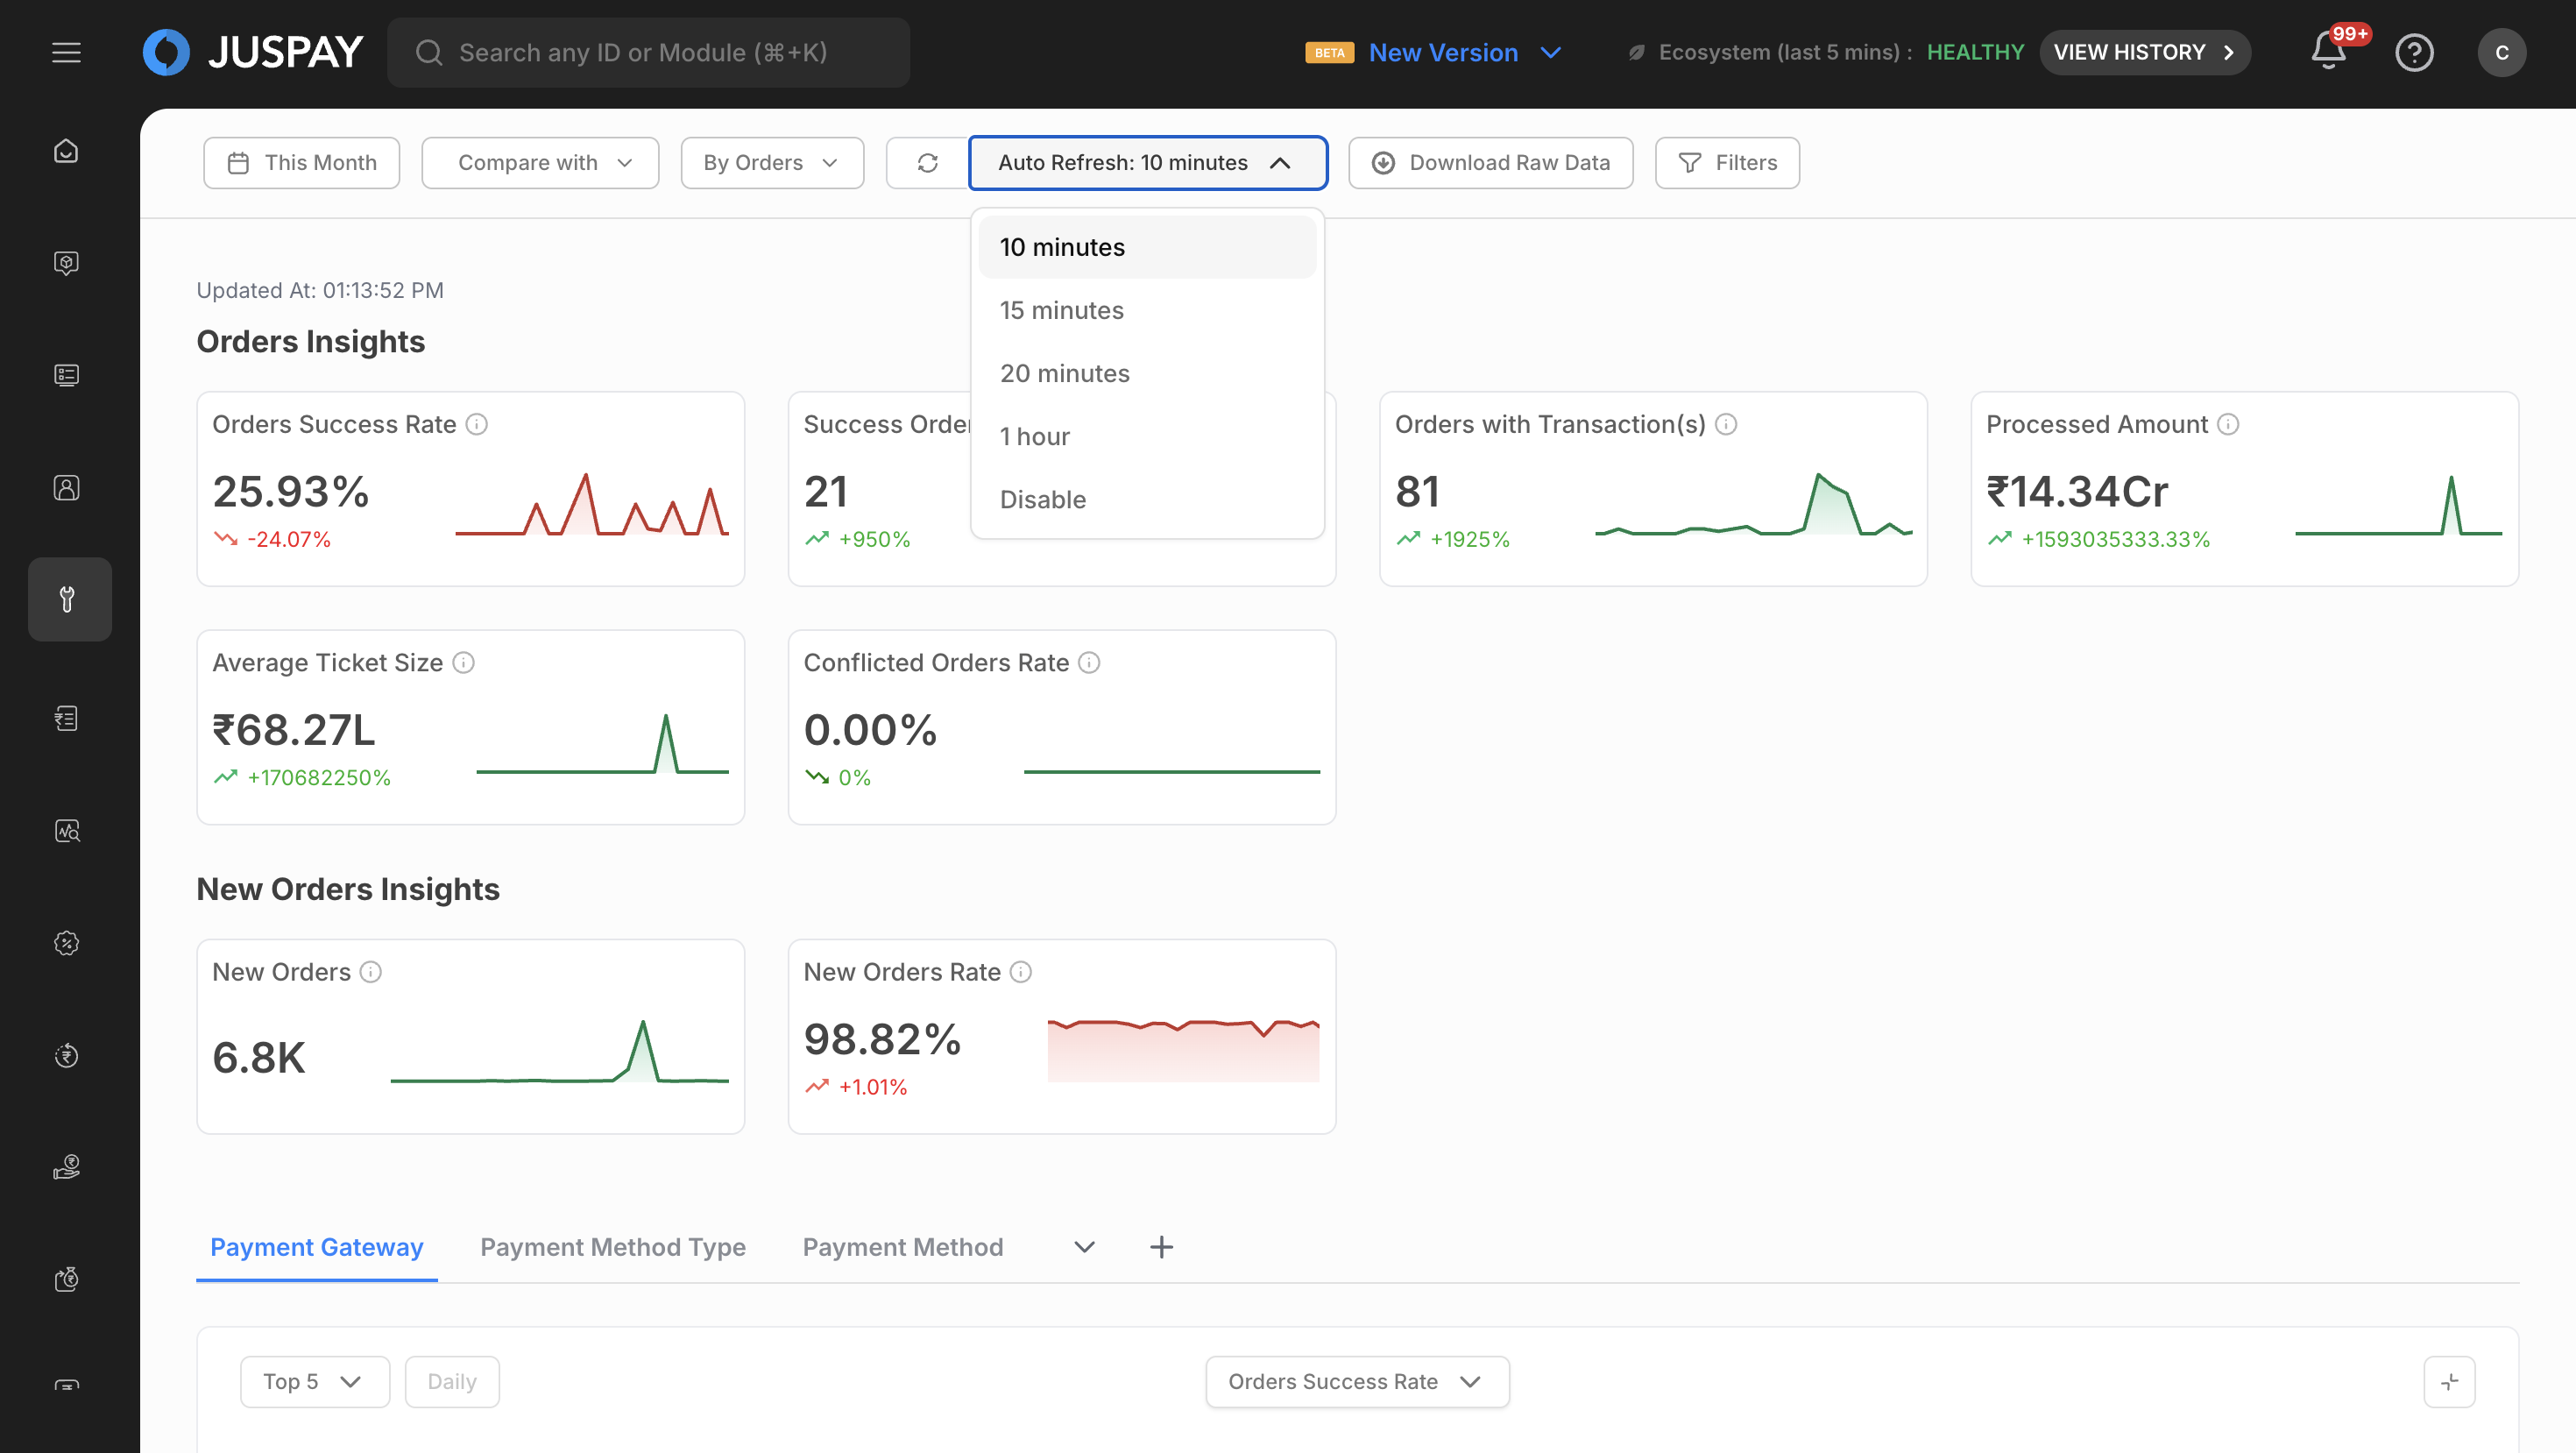
Auto Refresh Filter (when enabled)
Purpose: Automatic data refresh at configurable intervals
Eligible Date Ranges: Auto-refresh only available for recent time periods:
Today
Last 30 minutes
Last 1 hour
Last 6 hours
Last 24 hours
Last 7 days
Last 30 days
This month
Background Updates: Automatic data updates without interrupting user workflow
Sync Filter (when auto-refresh is disabled)
Purpose: Manual data synchronization
Usage: Click to refresh all dashboard data manually
Use Case: When you need the most current data but don't want automatic refreshing
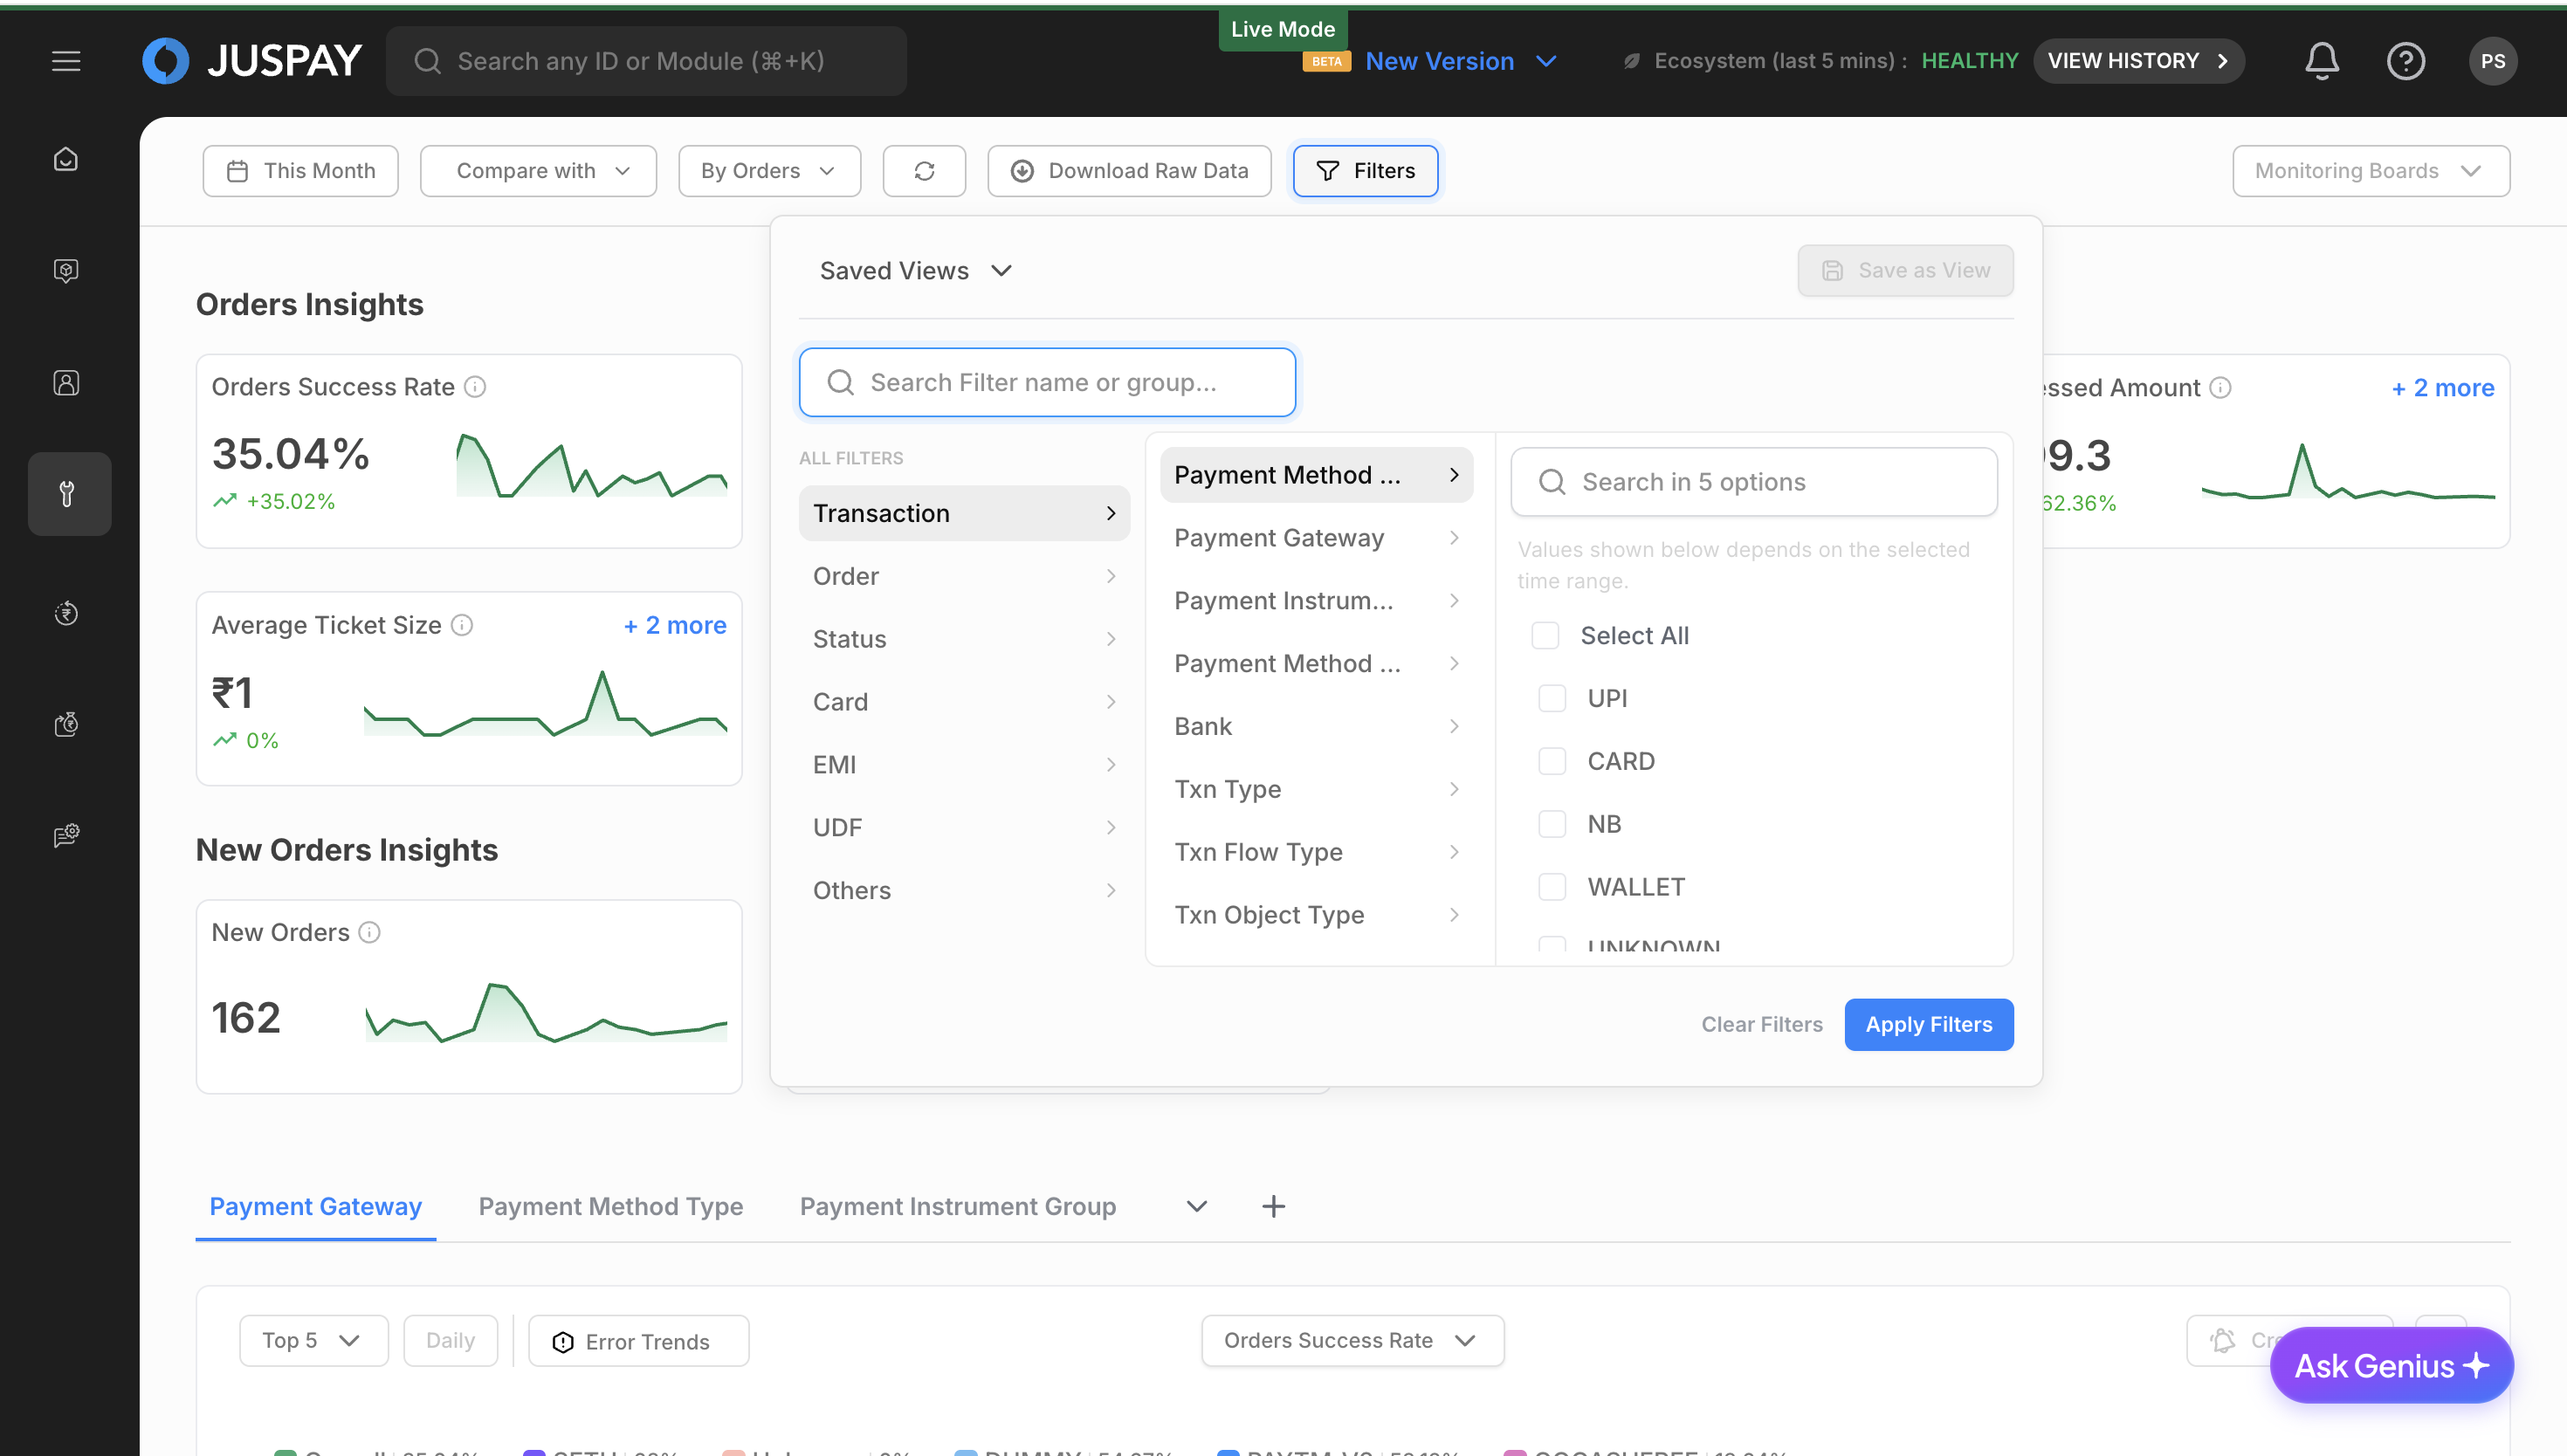
Dynamic Segments
Dynamic segments are loaded based on the selected viewing mode and provide powerful filtering capabilities:
Segment Characteristics
Mode-Dependent: Available segments vary by TXN/ORDER/CUSTOMER mode
API-Driven: Segments are fetched from analytics endpoints based on data availability
Searchable: Use search functionality to quickly find specific segments
Multi-Selection: Select up to 3 segments simultaneously (limited to 1 when time comparison is enabled)
Applying Segments
Click on the "Add Segments" button to open the segment selection panel.
Search for specific segments using the search input placeholder "Search Segments".
Select segments by clicking on them (maximum 3 selections).
Remove segments by clicking the remove button on selected segments (segments beyond the first 3 are removable).
Segments are automatically applied and update the dashboard data.
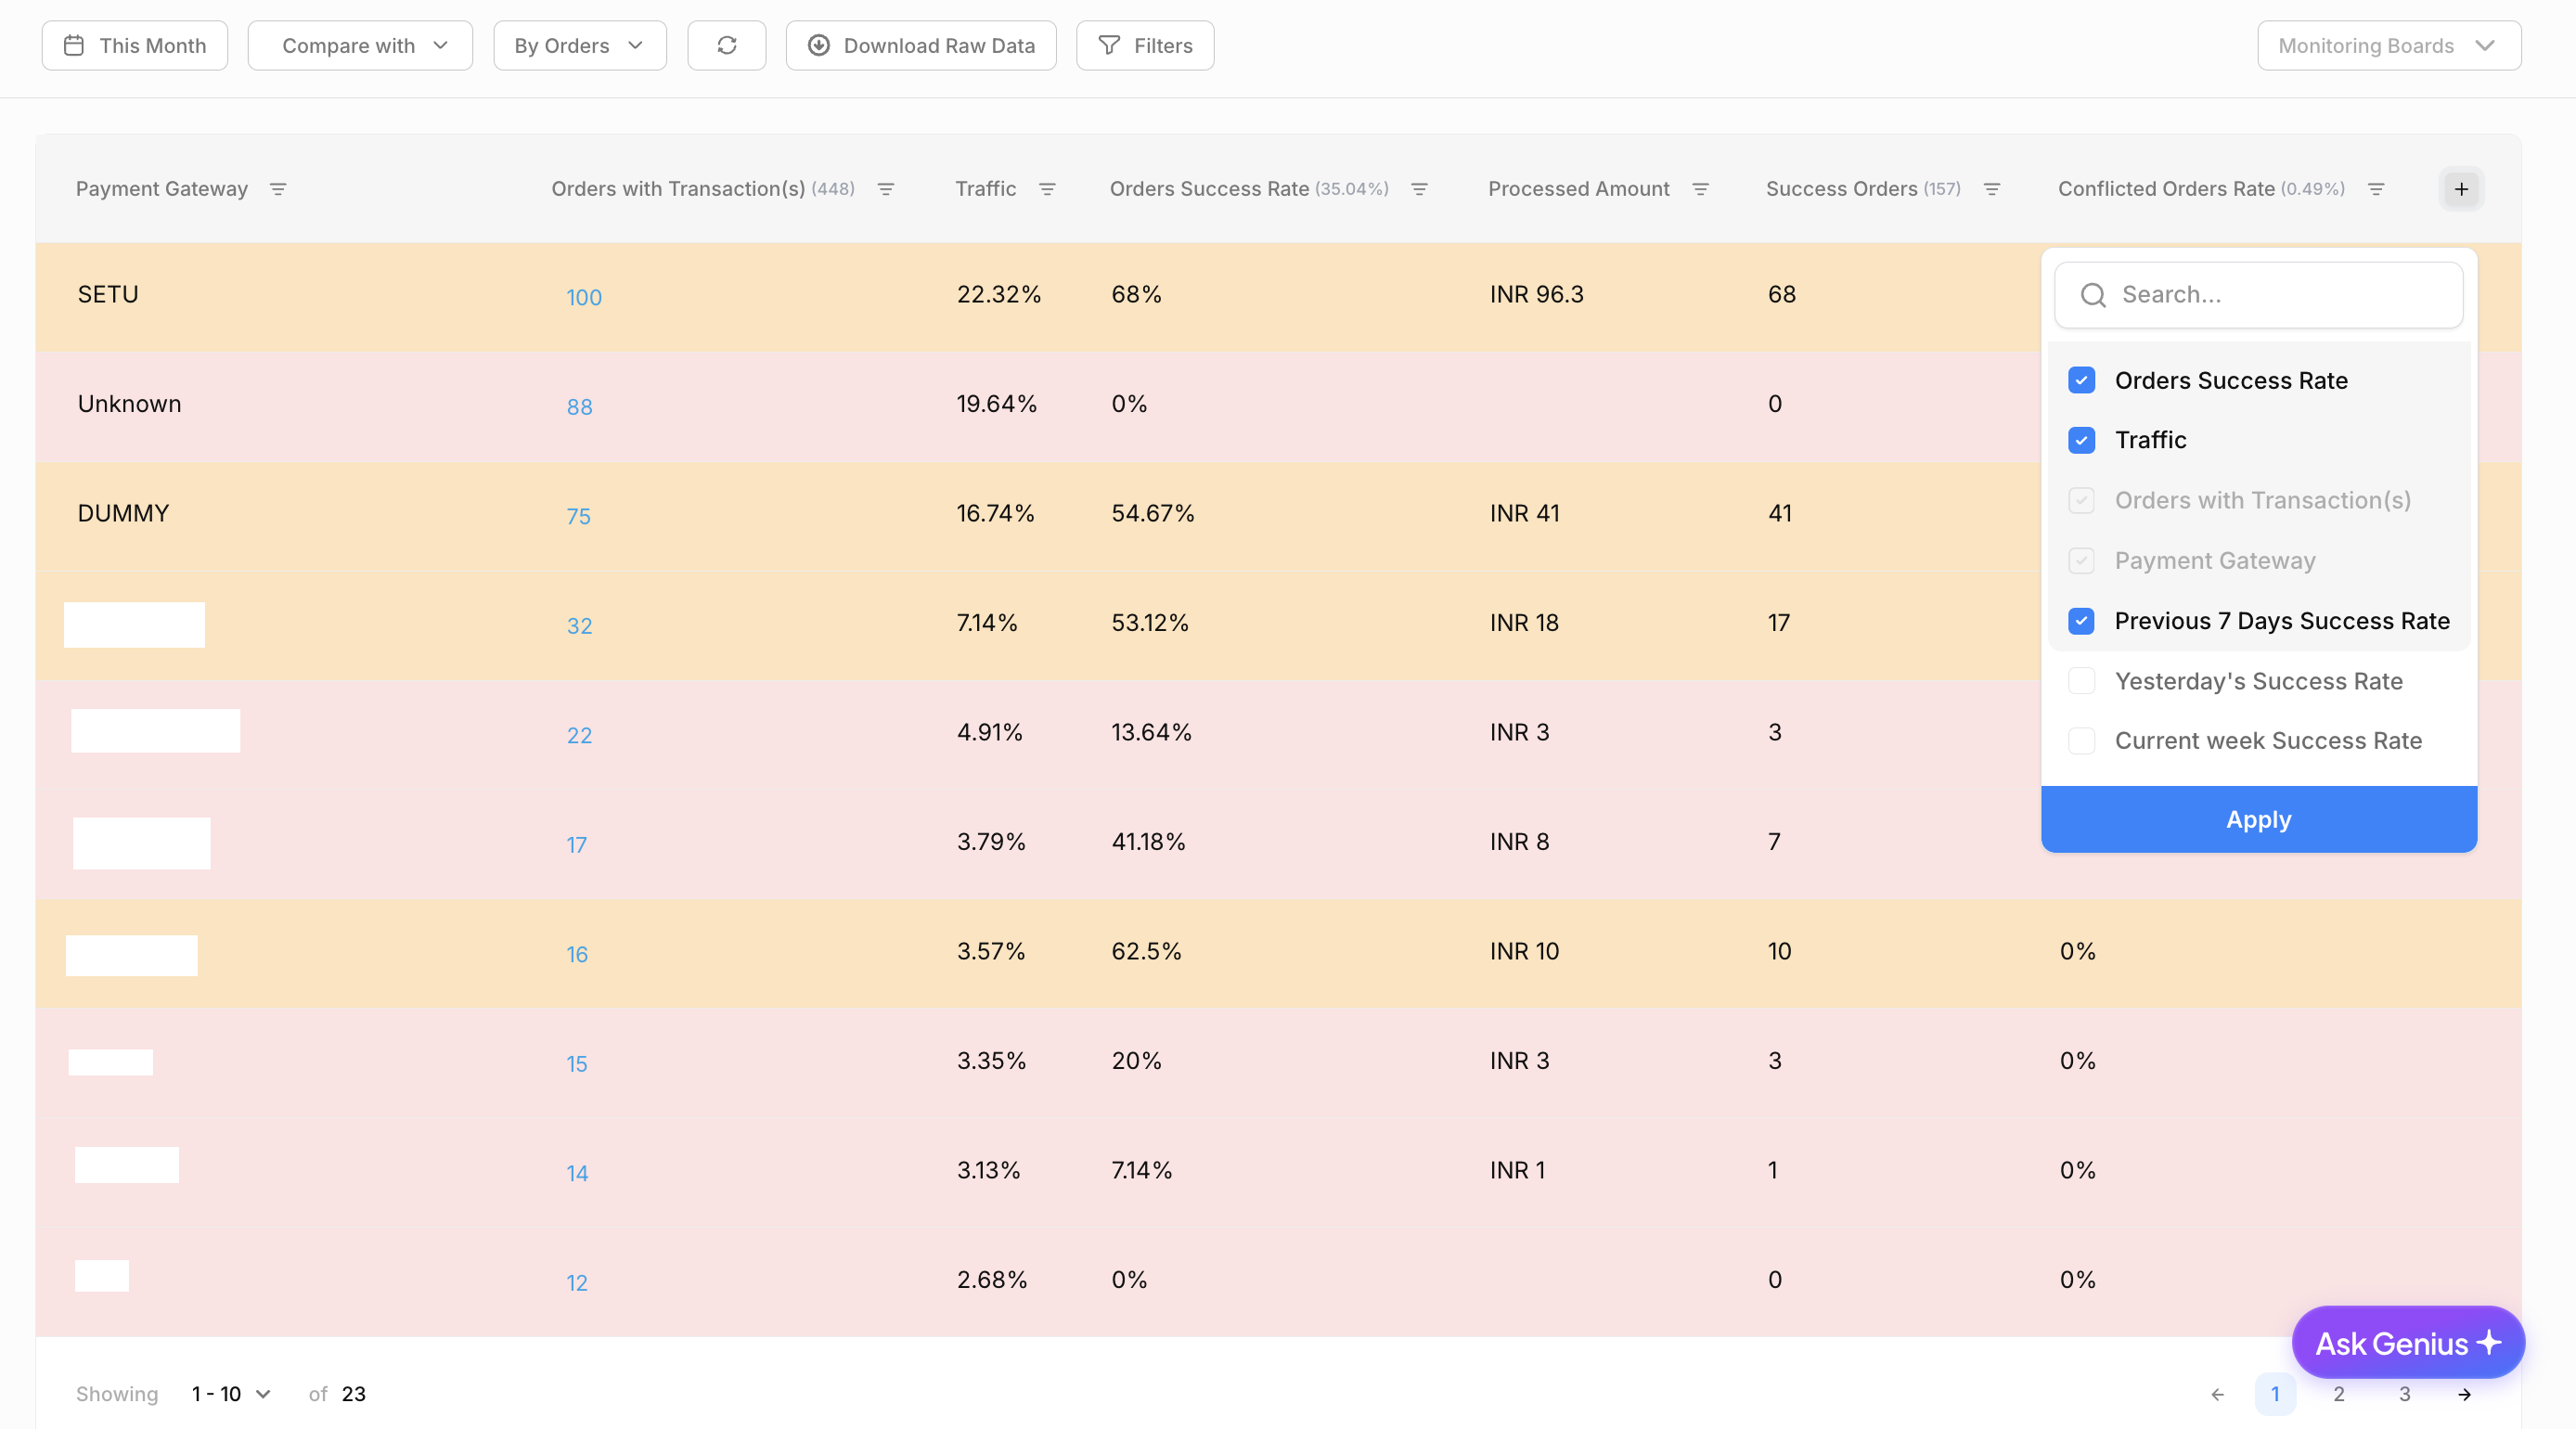
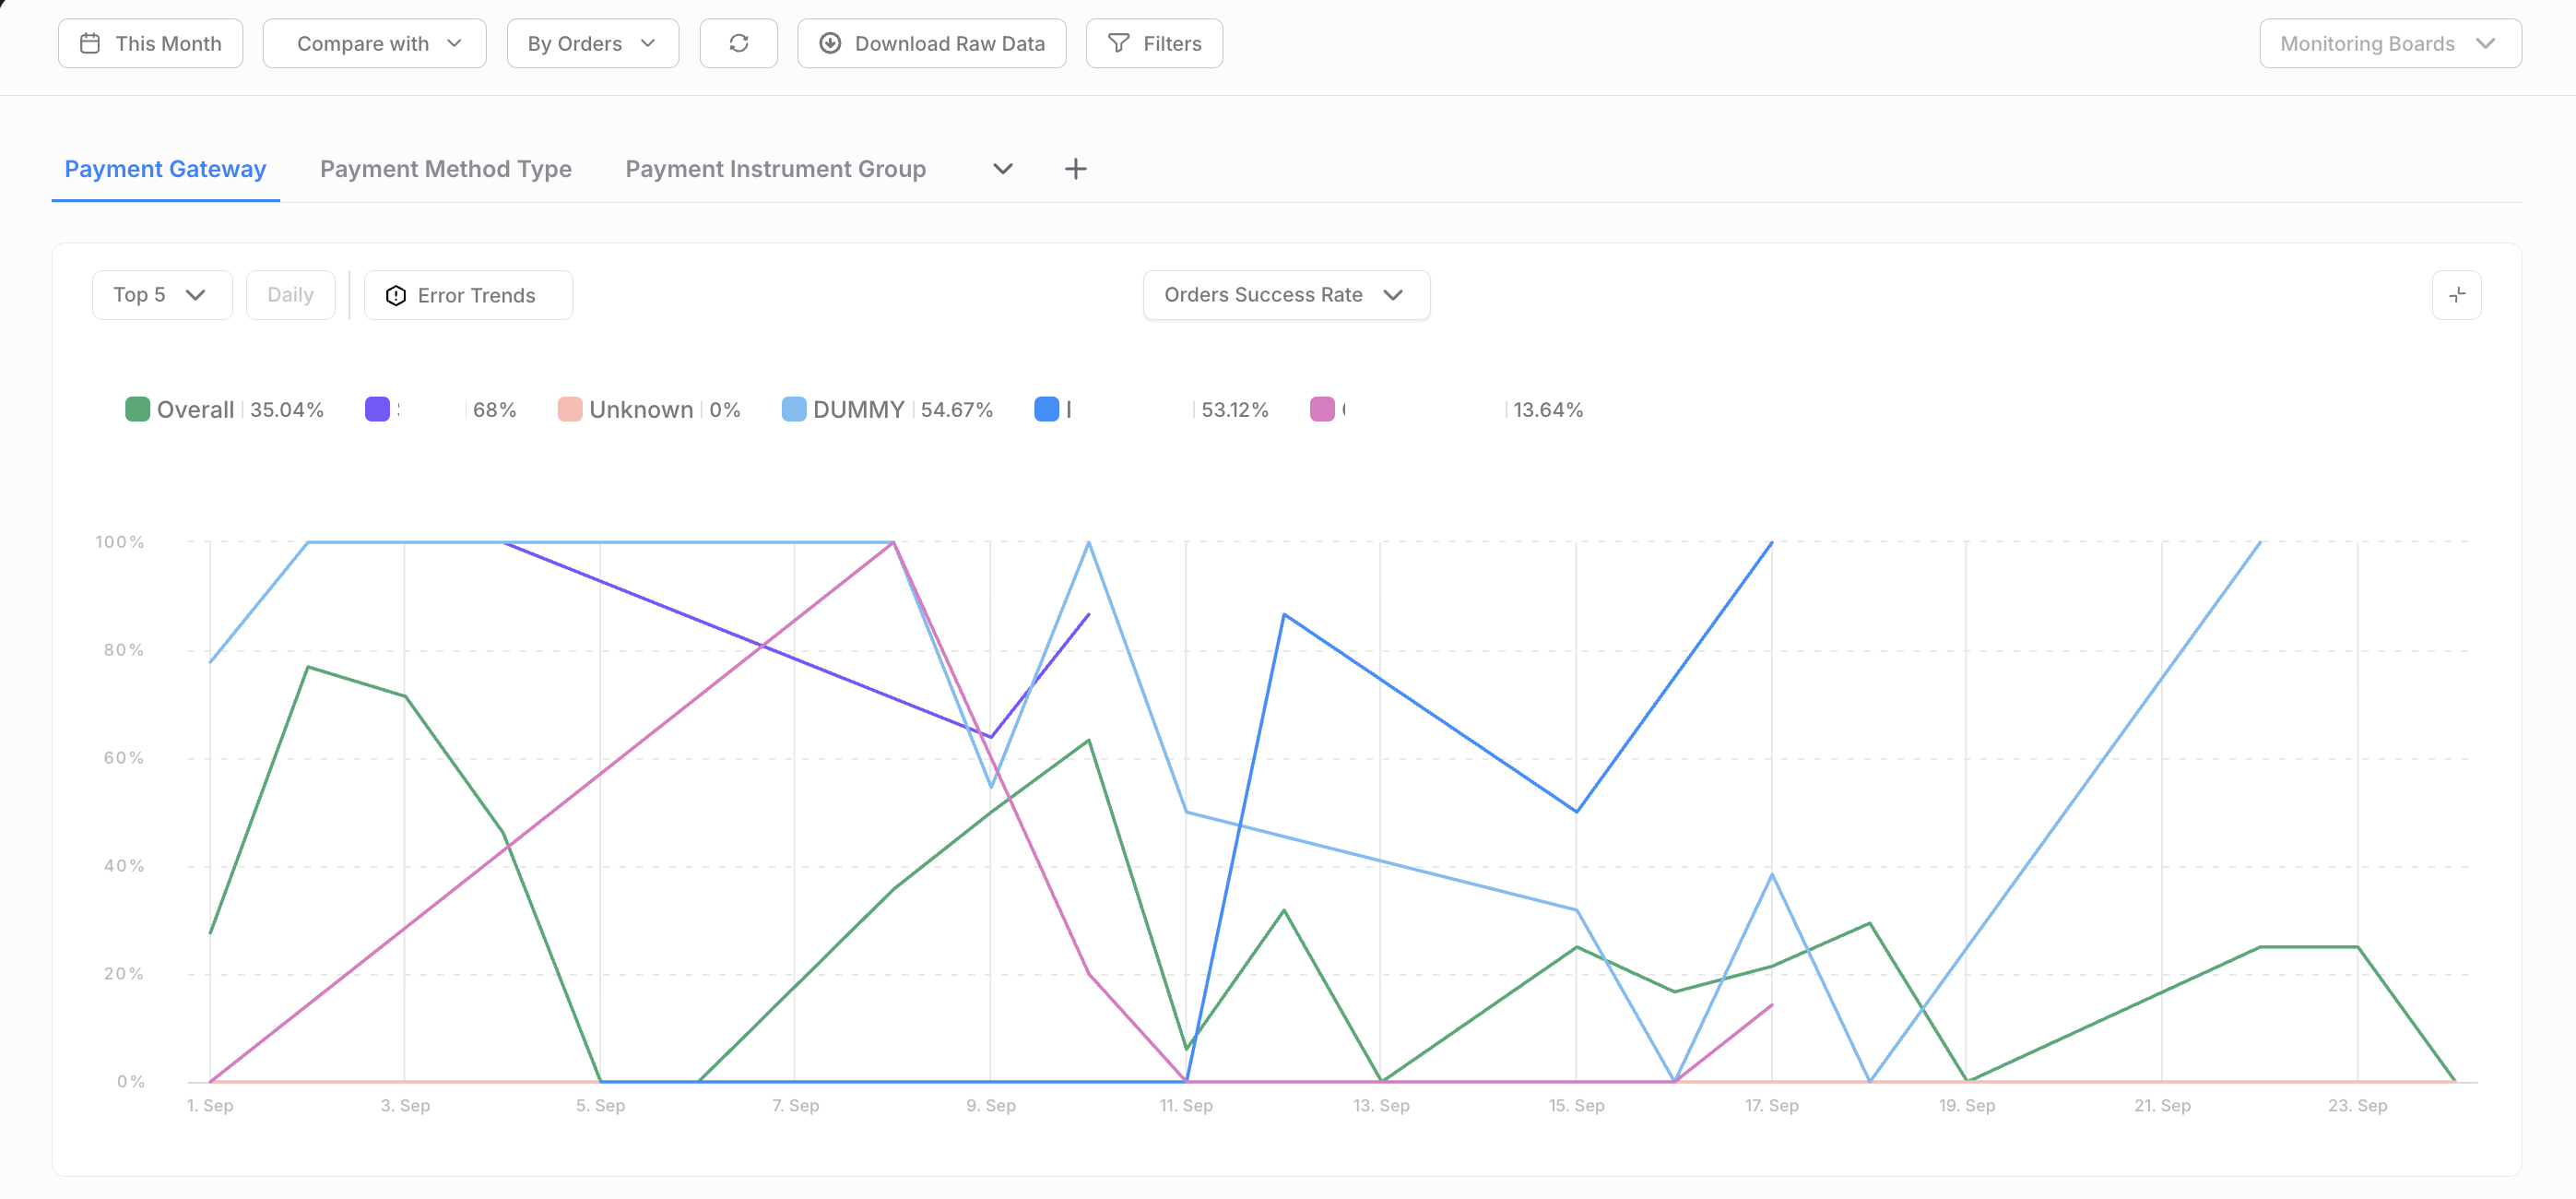
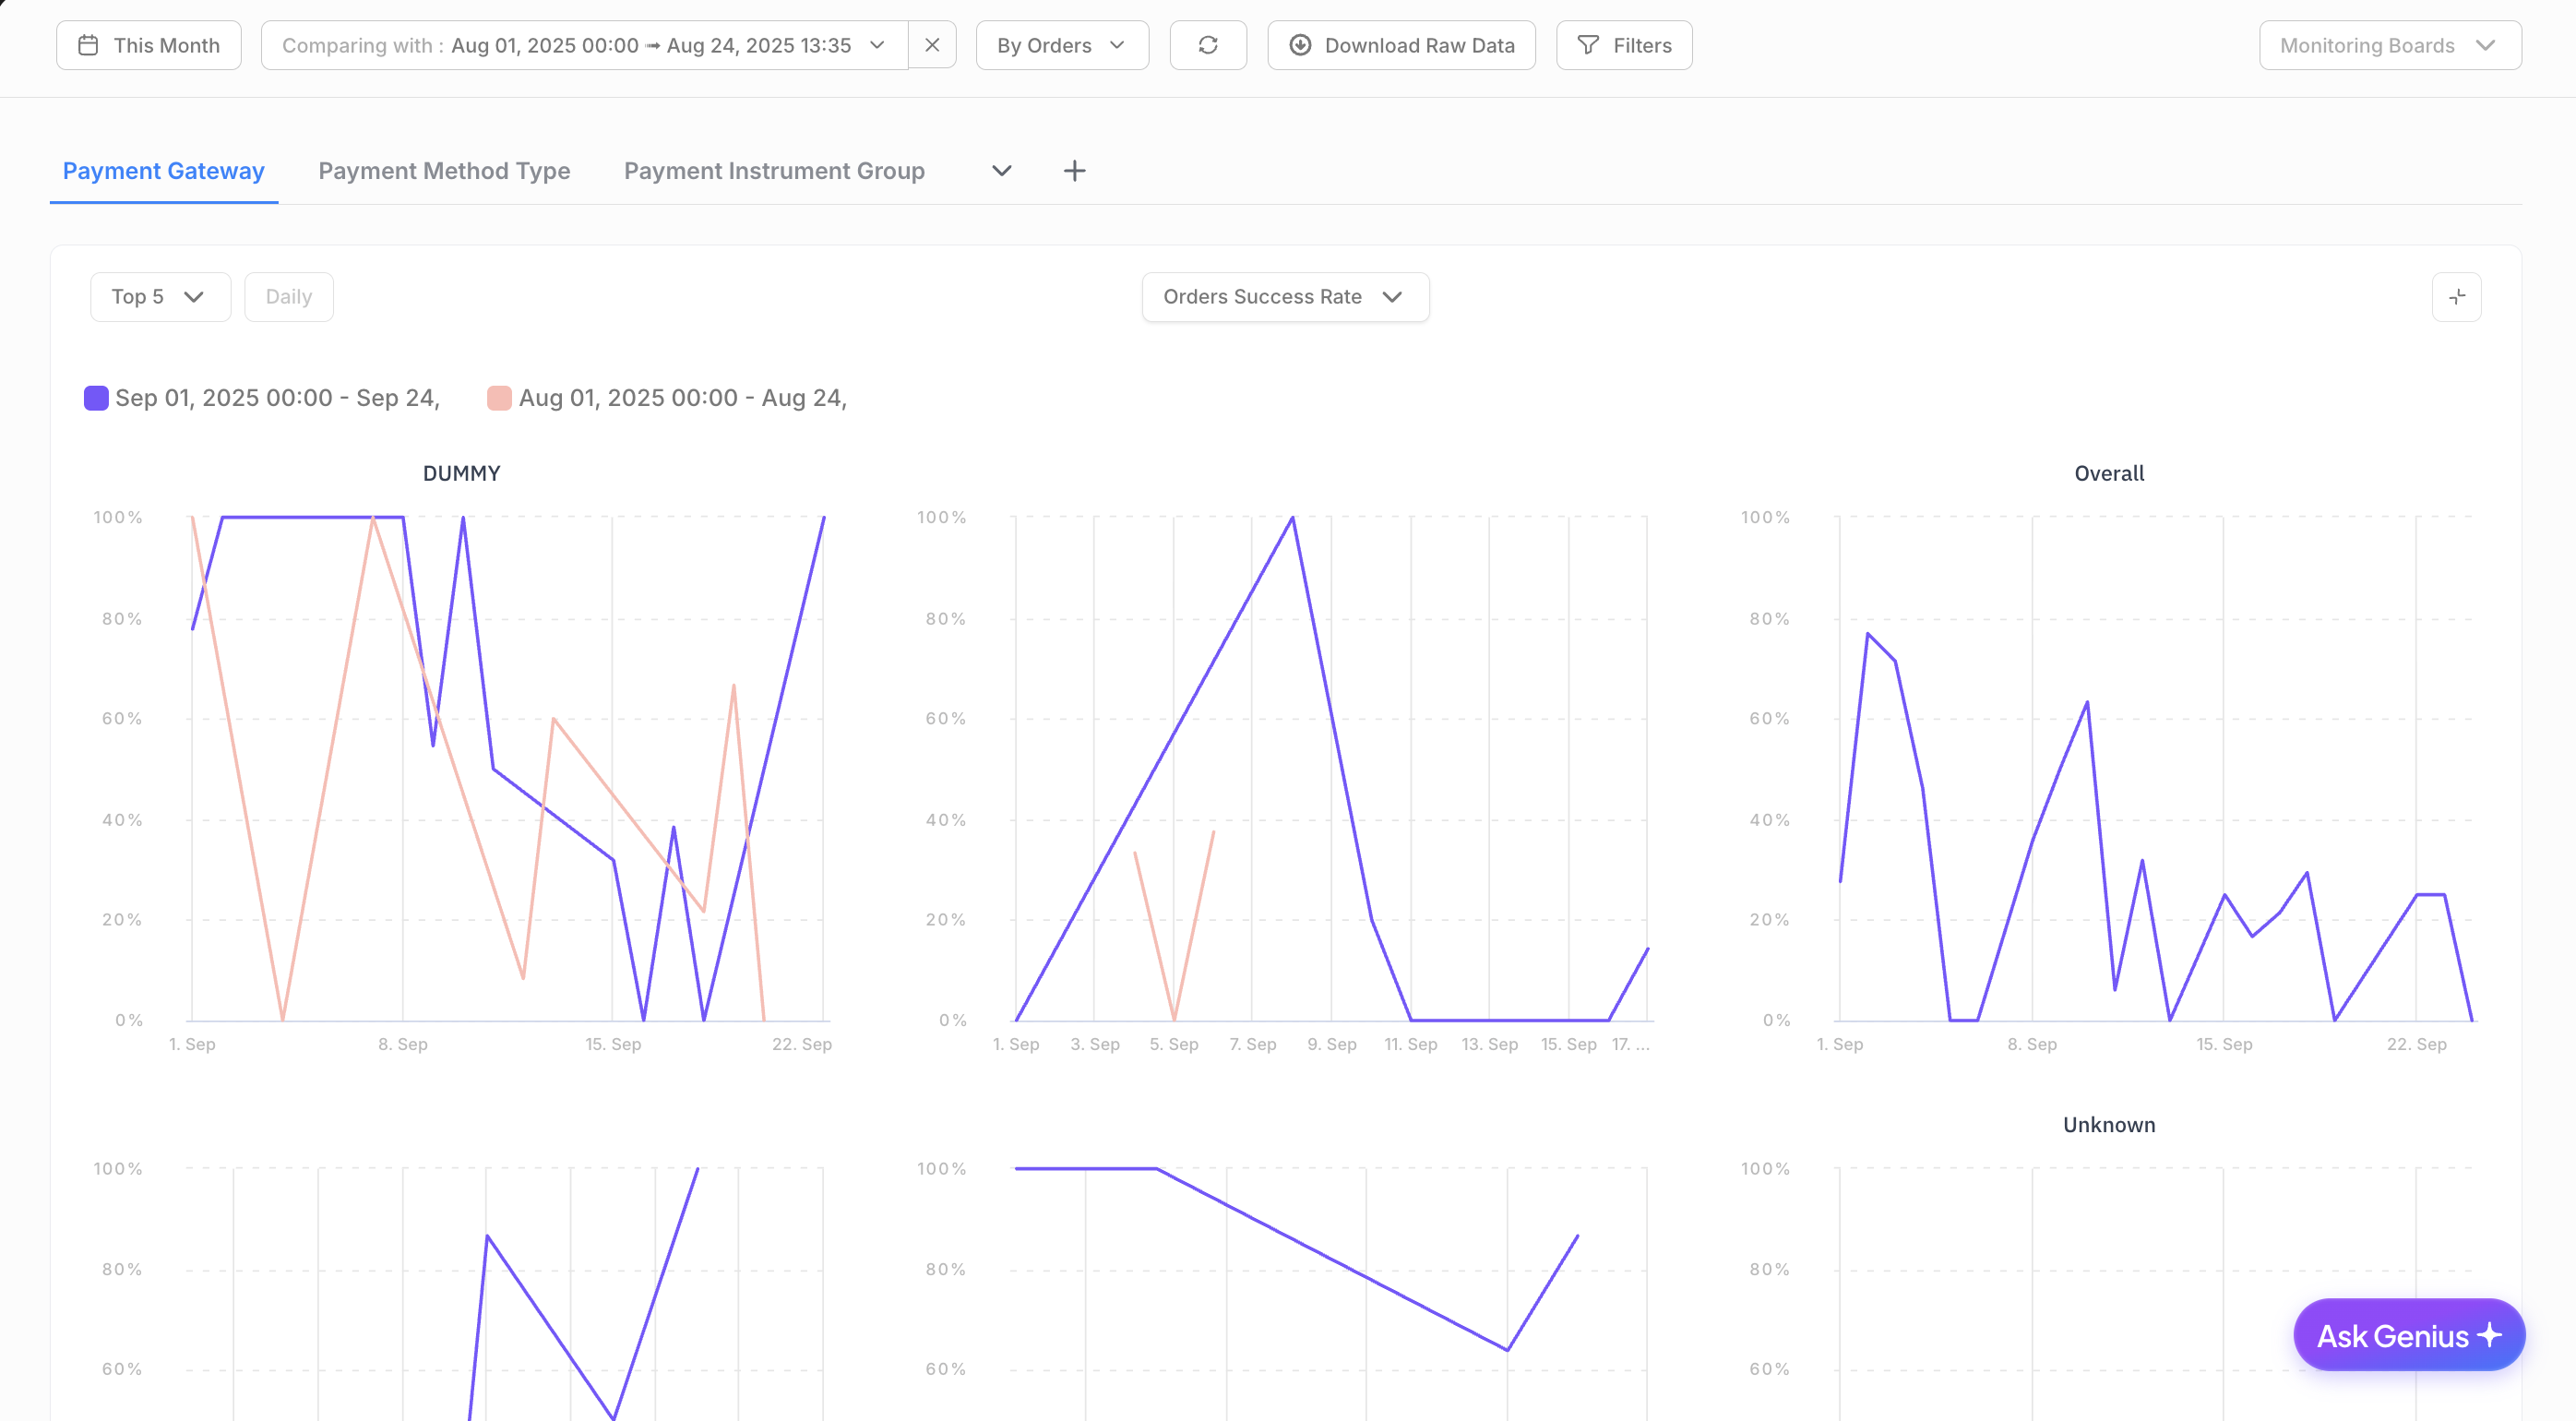
Chart Analytics
Creating and Viewing Charts
Chart Types Available
Time Series Charts: Interactive line charts showing trends over time
Multiple Metrics: Select multiple metrics for comparison
Chart Interactions
Hover over data points to see detailed information and tooltips.
Zoom and Pan: Use mouse or touch gestures to zoom into specific time periods.
Legend Toggle: Click legend items to show/hide specific data series.
Chart Features
Outage Detection (Conditional)
Visual Indicators: Chart overlays showing payment method outage periods
Conditions Required:
Selected segment must include "paymentmethodtype"
Time range must be 24 hours or less
Merchant ID must be available
Outage data must be available
Single element selection required
Real-time Monitoring: Live outage detection and visualization
Threshold Values
Configurable Lines: Set custom threshold lines on charts
Performance Monitoring: Visual indicators for performance targets
Desktop/Mobile: Threshold display optimized for each platform
Time Comparison
Period Comparison: Compare current period with previous period
Delta Calculations: Show changes between periods with color coding
Visual Indicators: Green for positive changes, red for negative changes
Table Integration: Delta columns appear in summary tables when time comparison is active
Error Rate Charts (when enabled)
Specialized Visualization: Dedicated error rate time series charts
Conditions: Available when single segment is selected and time comparison is not active
Detailed Analysis: Comprehensive error pattern analysis
Chart Customization
Chart Features
Advanced Interactions: Full zoom, pan, and selection capabilities
Detailed Tooltips: Comprehensive tooltip information
Export Options: Chart export functionality
Analytics Table
Summary Tables
The analytics table provides comprehensive breakdowns of transaction metrics across different segments:
Table Features
Sortable Columns: Click column headers to sort data
Pagination: Navigate through large datasets efficiently
Column Customization: Choose which columns to display
Export Functionality: Download table data in various formats
Advanced Sorting: Multi-column sorting capabilities
Column Selection: Choose specific columns to display
Root Filtering: Advanced filtering within table data

Table Actions and Interactions
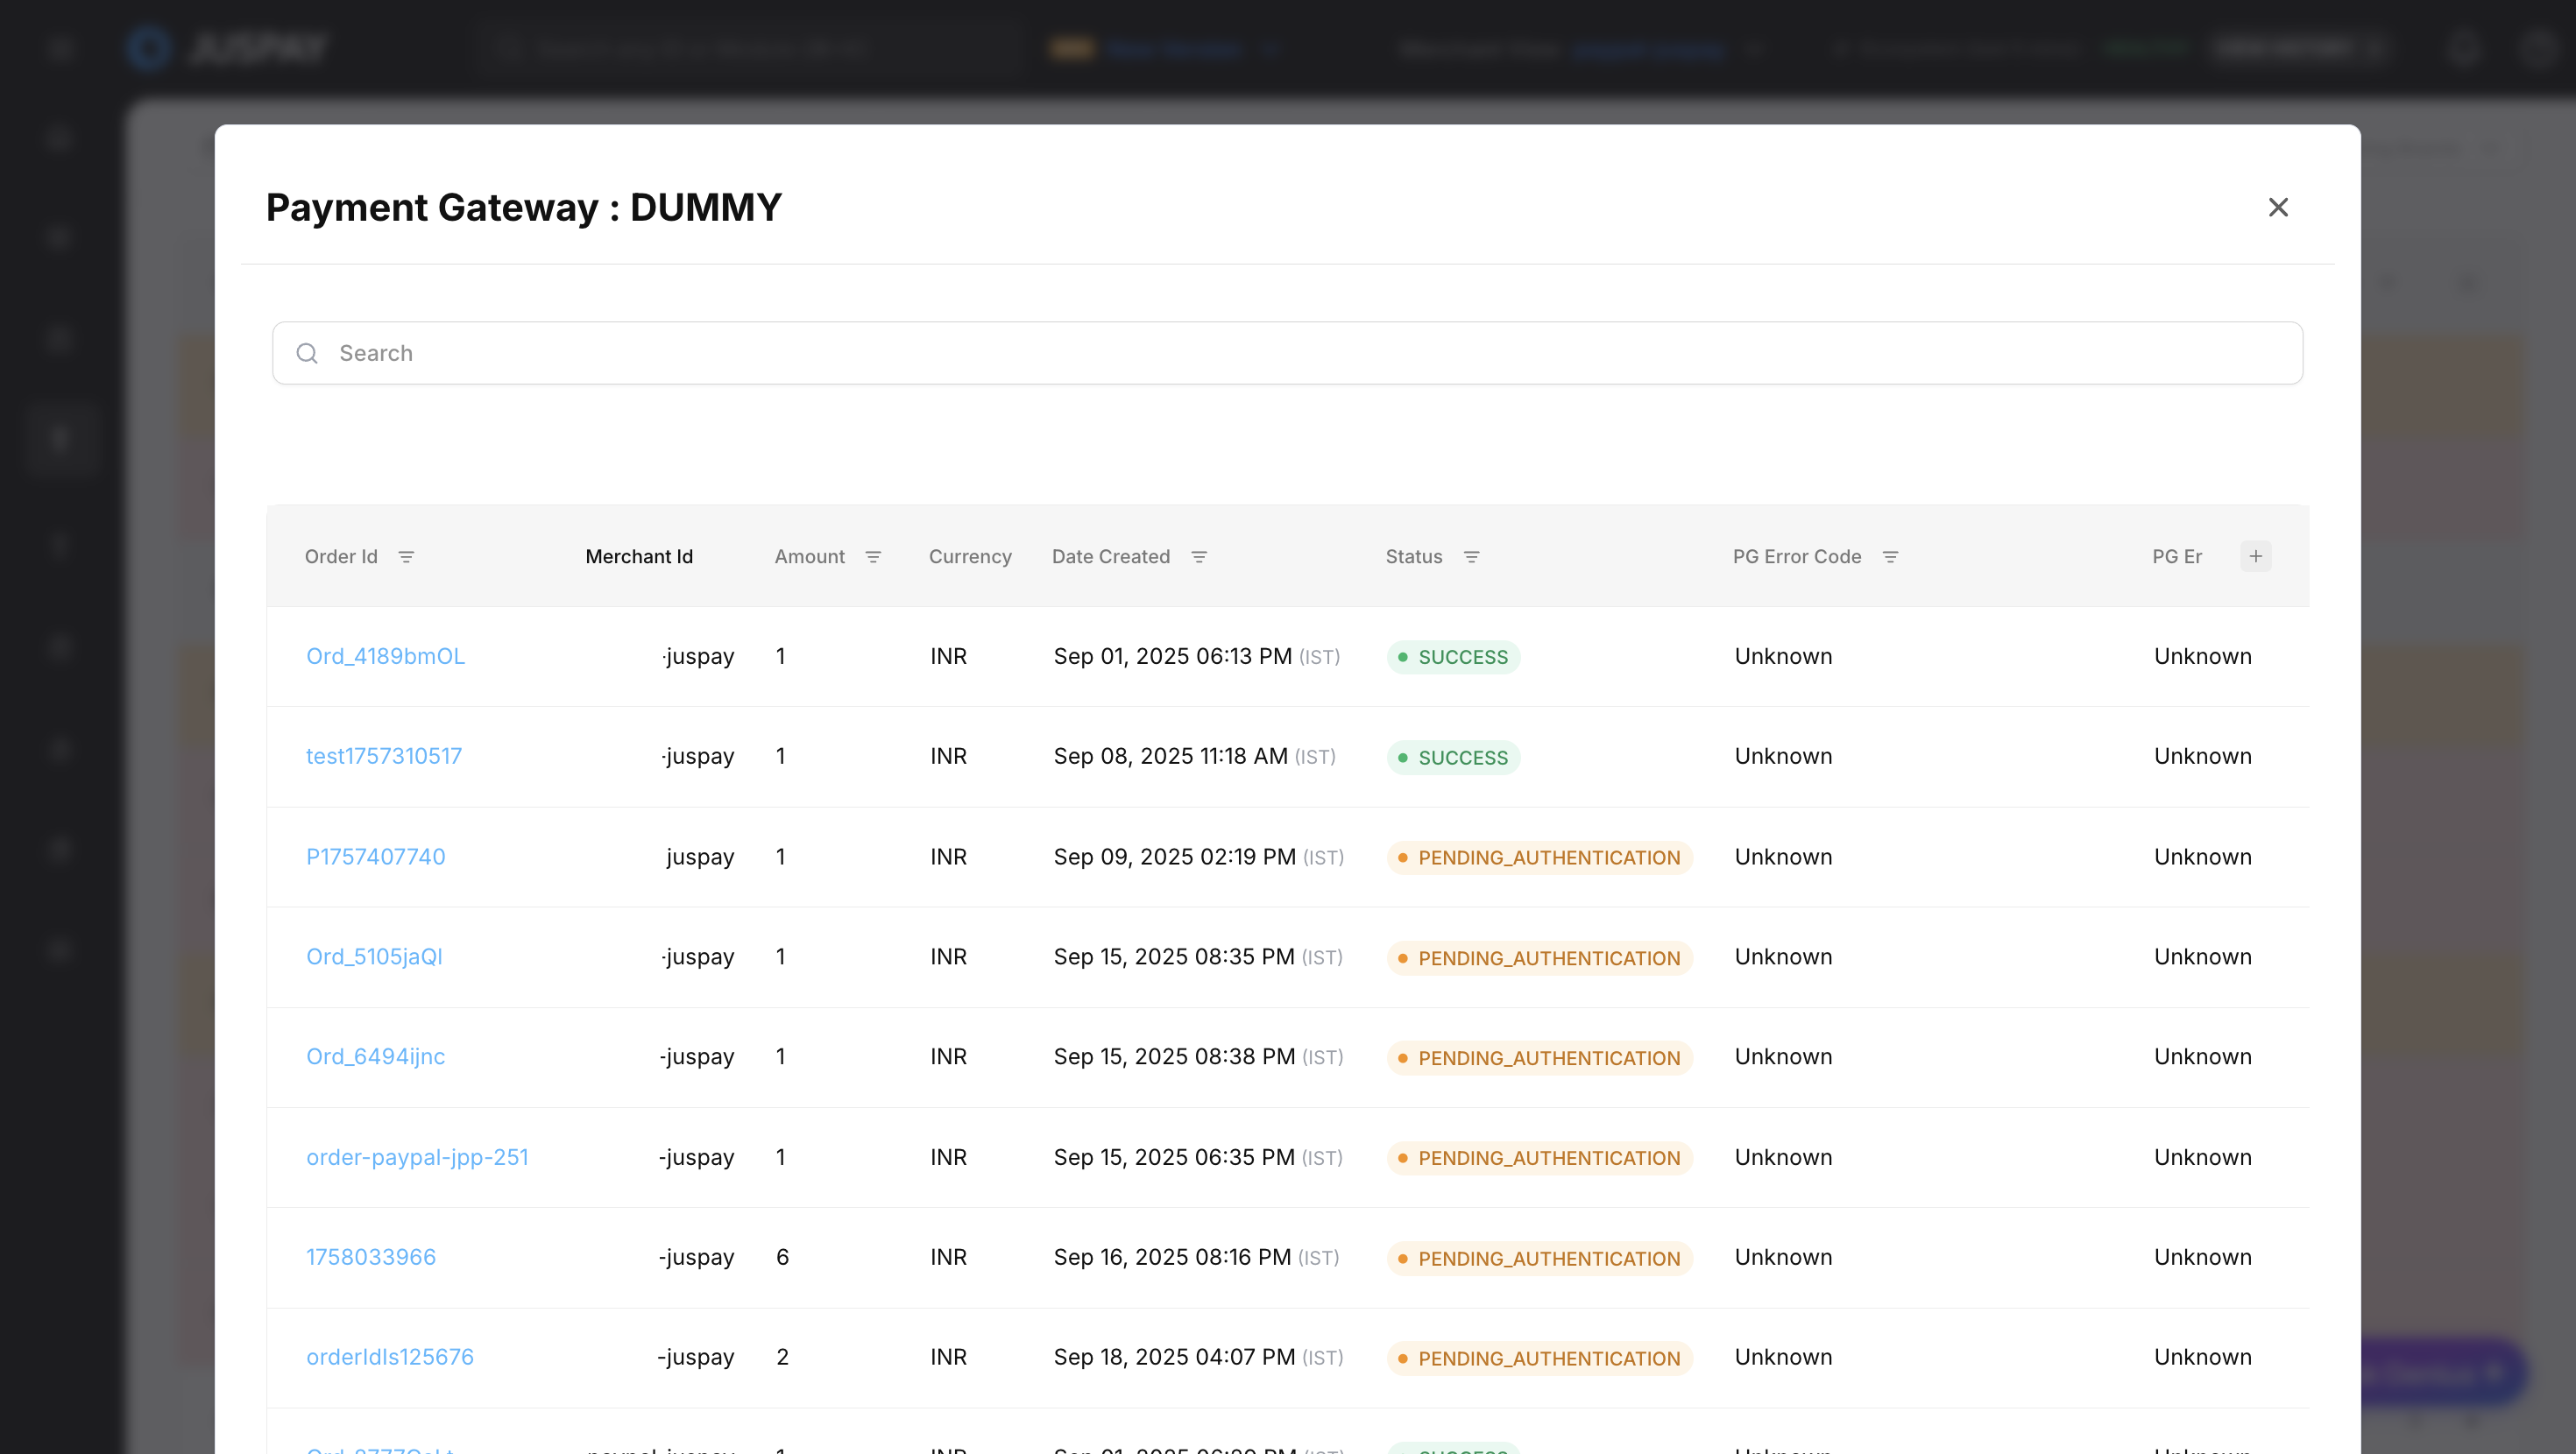
Volume Analysis
Click volume numbers to open detailed volume breakdown modals.
Analyze patterns using the detailed breakdown data.
Performance Metrics
Success Rates: View success rates with trend indicators
Processing Times: Monitor latency across different percentiles
Error Analysis: Detailed error distribution and patterns
Industry Comparison (when enabled)
Benchmark Data: Compare performance against industry standards
Relative Performance: Understand your position in the market
Improvement Opportunities: Identify areas for optimization
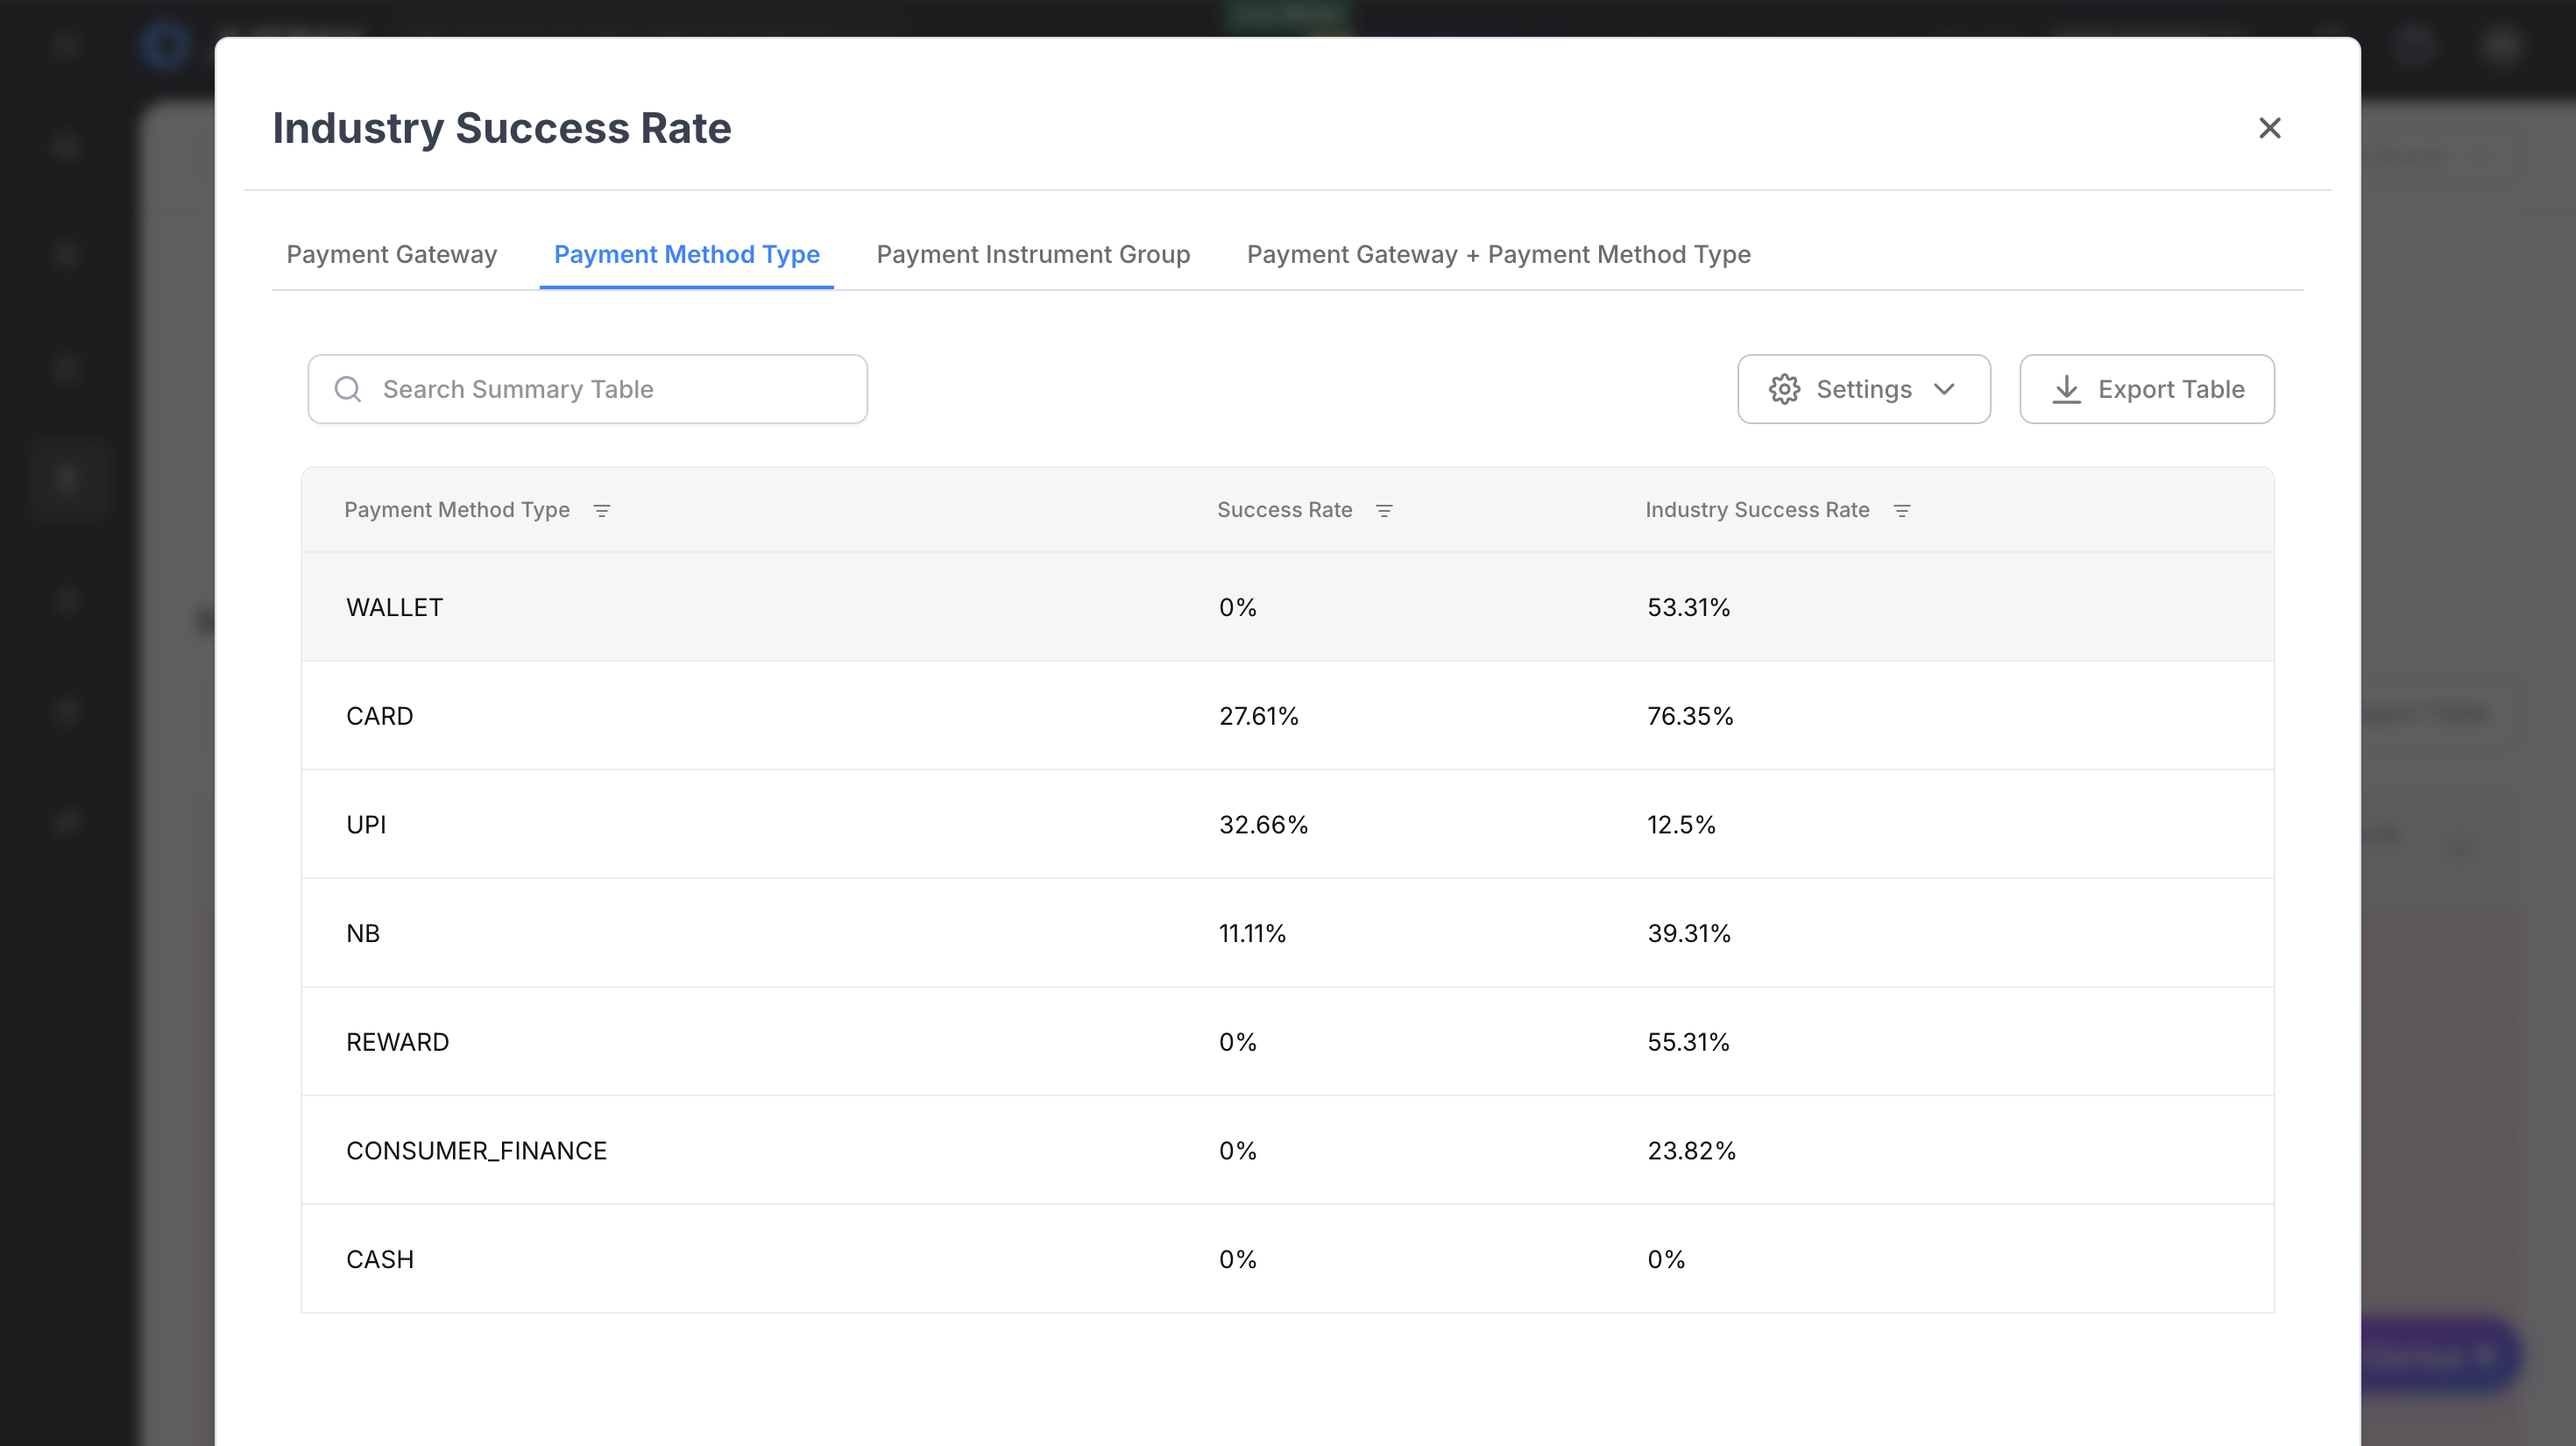
Table Customization
Column Management
Click the "Choose Columns" button.
Select/deselect columns to customize your view.
Reorder columns by dragging and dropping.
Save preferences for future sessions.
Sync and Refresh
Manual Refresh
Sync Button
Purpose: Manually refresh all dashboard data
Usage: Click the "Sync" button to get the most current data
When to Use: When you need immediate data updates or suspect data staleness
Visual Feedback: Loading indicators show refresh progress
Auto-Refresh (when available)
Configuration
Select Interval: Choose from available auto-refresh intervals (8s, 12s, 20s, 30s, 40s).
Enable/Disable: Select "Disable" to turn off automatic refreshing.
Eligible Periods: Auto-refresh only works for recent time periods (see eligible date ranges above).

Auto-Refresh Behavior
Background Operation: Runs without interrupting your workflow
Efficient Updates: Uses React Query for optimized data fetching
Visual Indicators: Subtle indicators show when data is being refreshed
Automatic Pause: Pauses when browser tab is inactive (browser-dependent)
Best Practices
Use for Monitoring: Ideal for real-time monitoring scenarios
Consider Performance: Shorter intervals may impact browser performance
Network Awareness: Auto-refresh may consume more bandwidth
Disable When Not Needed: Turn off auto-refresh for historical analysis
Data Export
Download Capabilities
Download Modes
Transaction Downloads
Data Type: Individual transaction-level data
Format: One row per transaction
Use Case: Detailed transaction analysis, reconciliation, audit trails
Available In: TXN mode
Order Downloads (NEW Feature)
Data Type: Aggregated order-level data
Format: One row per order with aggregated transaction information
Use Case: Business analysis, order completion tracking, customer behavior analysis
Available In: ORDER mode
What's New: Downloads in "By Orders" mode now provide order-level data instead of transaction details
What Changed: Previously, both "By Orders" and "By Transactions" modes downloaded transaction-level data
Download Process
Set Filters: Apply desired time range and segment filters.
Select Mode: Choose appropriate viewing mode (TXN for transactions, ORDER for orders).
Click Download Raw Data: Click the download raw data button (available when access conditions are met).
Choose Fields: Select which data fields to include in your export.
Use Presets (Optional): Save frequently used column selections as presets for quick reuse.
Generate Export: Click "Generate Export" to create the file.
Download File: Download the file when processing is complete.
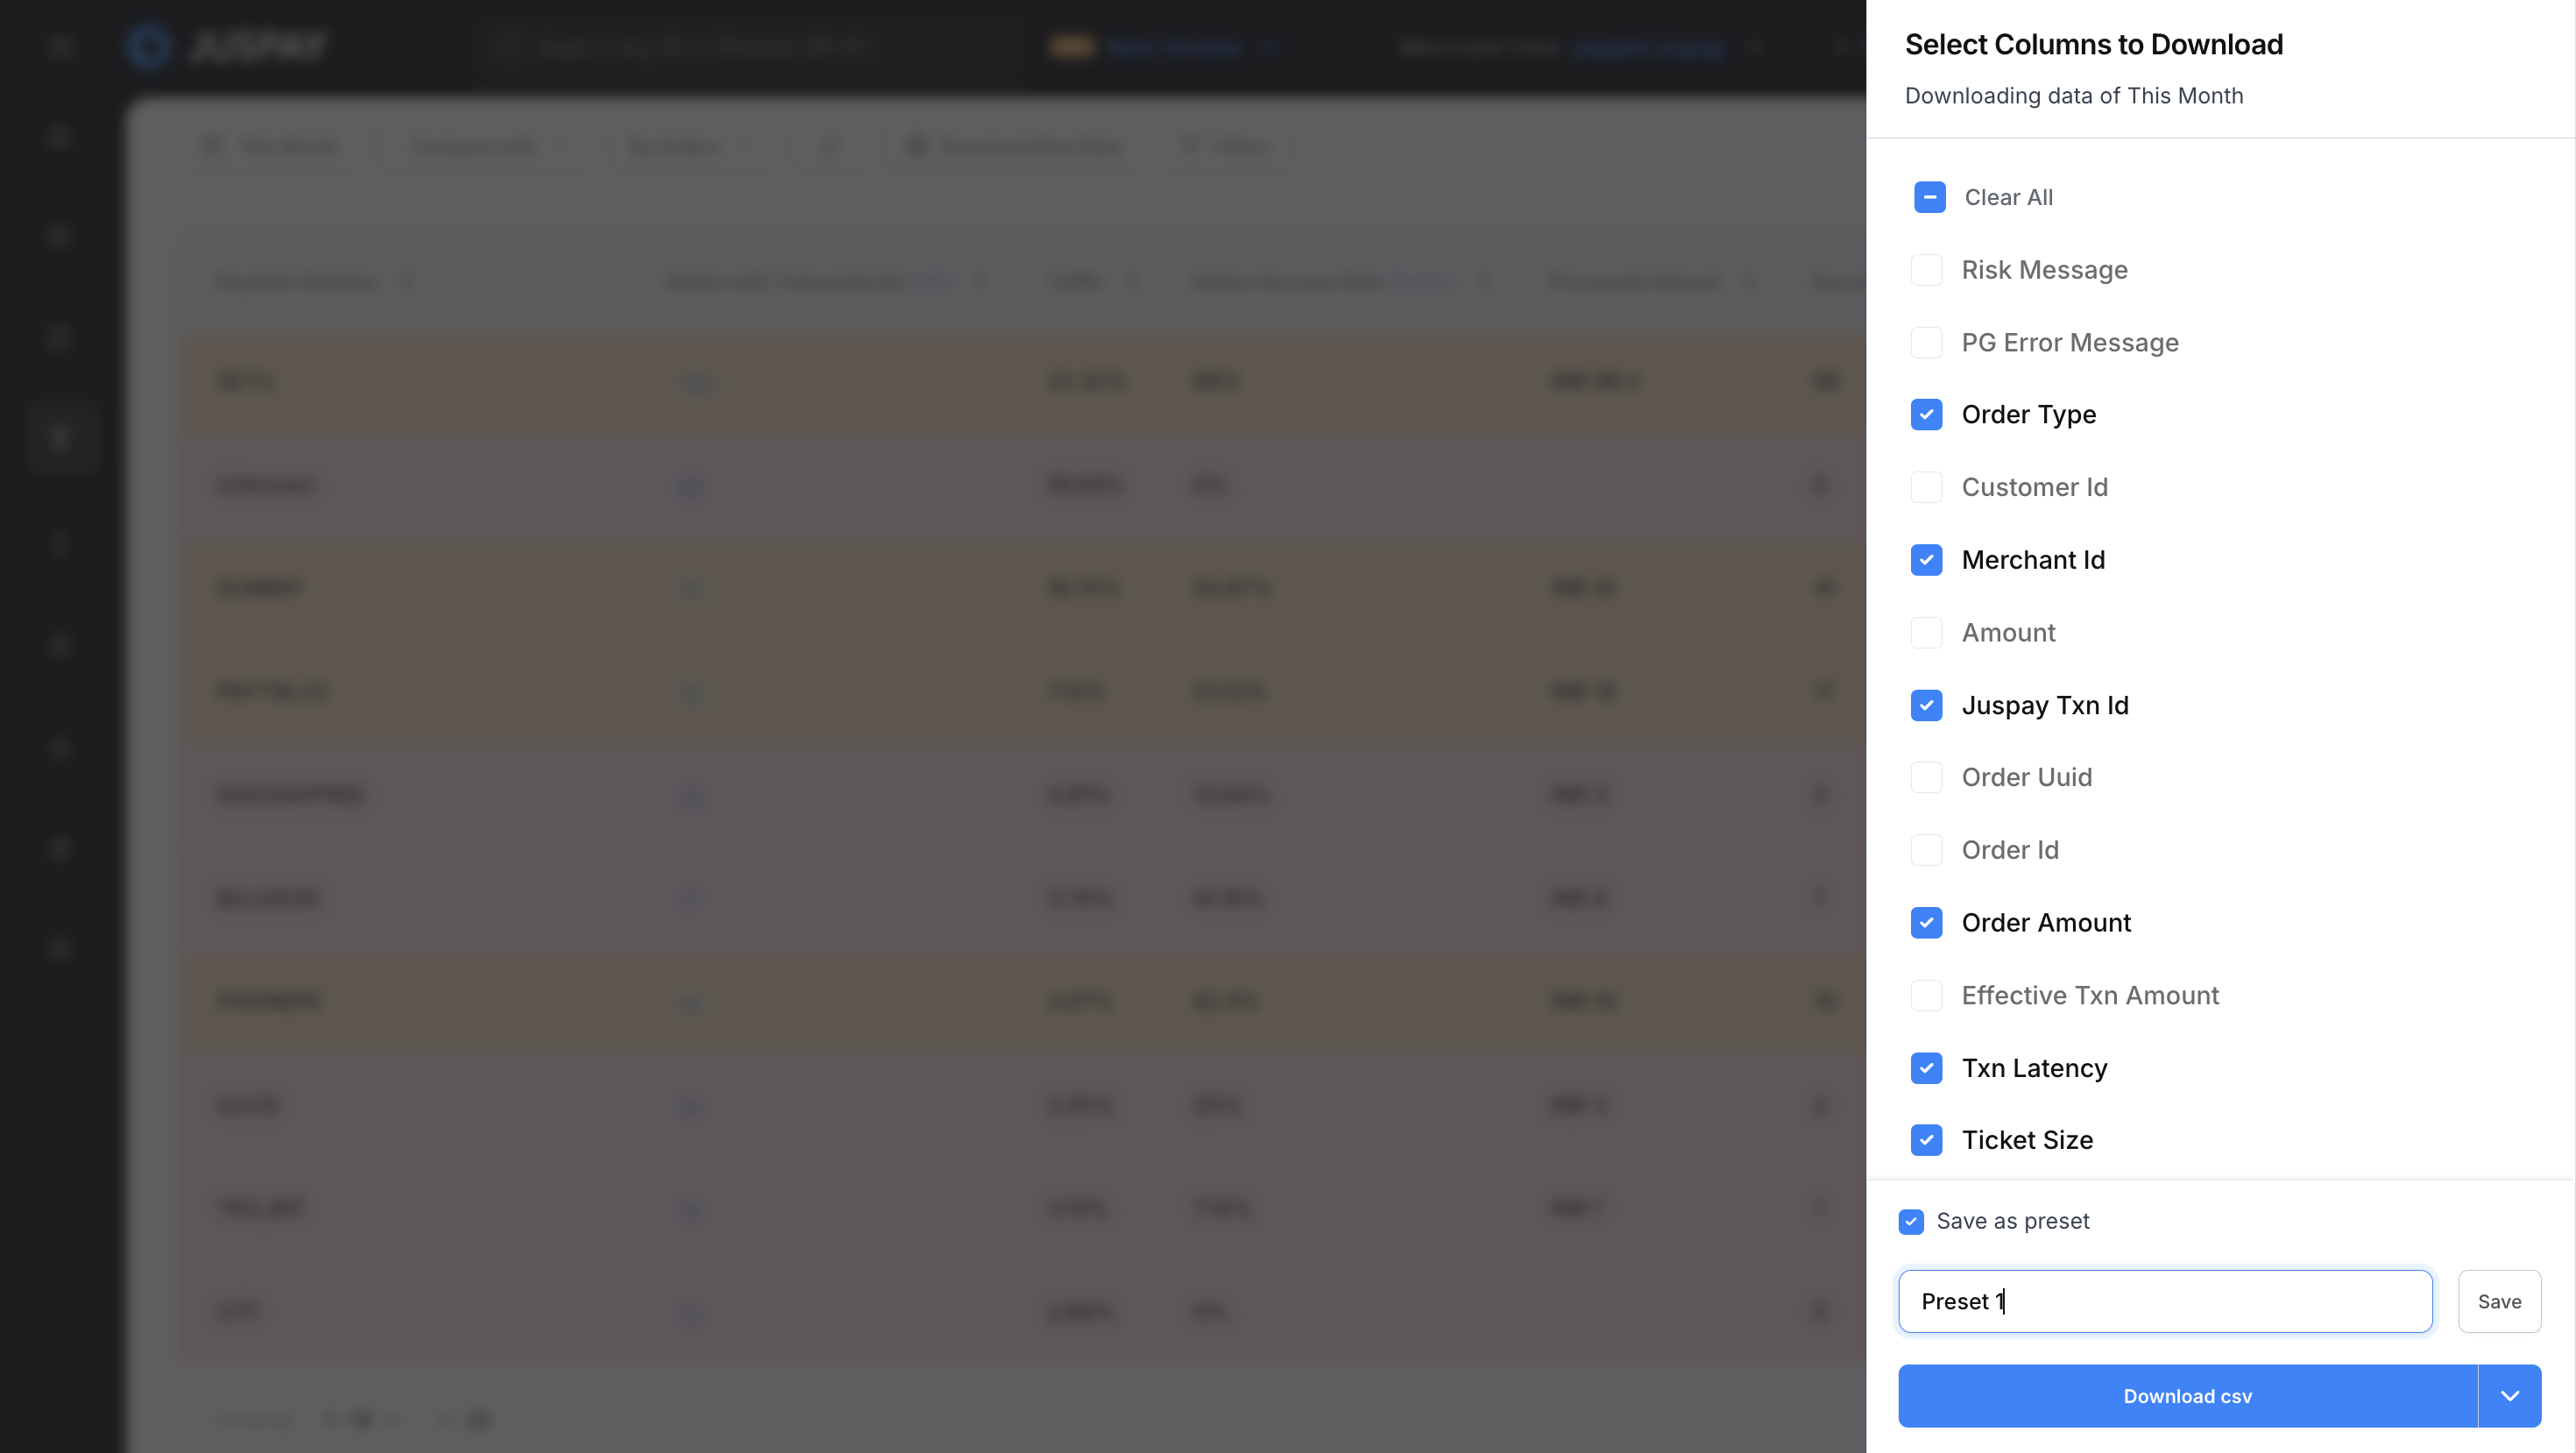
Download Field Selection with Presets
Preset Management:
Save as Preset: Save your current column selection as a named preset for future use
Use Saved Presets: Quickly apply previously saved column selections from the presets dropdown
Update Presets: Modify existing presets when you change column selections
Remove Presets: Delete presets you no longer need using the trash icon
Auto-Selection: The system automatically selects the most recently used preset when opening the download modal
Preset Features:
Preset Validation: Prevents duplicate preset names and ensures unique column combinations
Preset History: Tracks when presets were last used for automatic selection
Preset Indicators: Shows which preset is currently active and if it has been modified
Quick Actions: Update existing presets or save modifications as new presets
Download Access Control
Merchant Context Access
Requirement: User context must be "MERCHANT"
Purpose: Ensures merchants can only download their own data
Verification: Automatic verification of merchant permissions
Analytics Merchant Selector (Alternative)
Configuration: Alternative access control via feature flag
Purpose: Provides additional access control mechanisms
Usage: When enabled, provides alternative download access
Conditional Access
Dynamic Display: Download buttons only shown when access conditions are met
Permission Verification: Real-time permission checking
Error Handling: Clear messaging when access is denied
Order-Level Download Onboarding
When order-level downloads are available, an interactive tutorial provides guidance:
Onboarding Content
"What's new?": Explains that downloads in "By Orders" mode now provide order-level data
"What changed?": Clarifies that previously both modes downloaded transaction-level data
"Need transaction details?": Guides users to switch to "By Transactions" mode for individual transaction data
Tutorial Features
Interactive Guide: Step-by-step walkthrough of new functionality
Auto-Next: Automatic progression through tutorial steps
Skip Option: Users can skip or complete tutorial as needed
One-Time Display: Tutorial shown once per user for new feature introduction
Use Cases
Real-Time Transaction Health Monitoring
Set viewing mode to TXN for transaction-level analysis
Set time range to last 1 hour or last 6 hours
Enable auto-refresh with 30-second intervals
Monitor Success Rate and Error Rate metrics
Add payment_method_type segment to monitor different payment methods
Export transaction data if issues are identified
Gateway Performance Comparison
Apply Gateway segment to select multiple gateways
Compare Success Rate, Processing Times, and Error Rates
Analyze latency percentiles (TP50, TP95, TP99)
Use charts to visualize performance trends
Export gateway performance data for review
Monthly Financial Impact Assessment
Set viewing mode to ORDER for business-level analysis
Set time range to previous month
Monitor Total Amount across different currencies
Add currency segment to analyze currency-specific performance
Use time comparison to compare with previous month
Export financial data for reconciliation
Troubleshooting
Permission Access Error:
If you see "You don't have access to transaction_analytics. Kindly get in touch with your merchant admin" - contact your administrator to verify Transaction Analytics module access permissions.
API Request Failures:
If analytics data fails to load, the system automatically logs "Analytics API Failing, Something went wrong" and will retry the request. Check your network connection and refresh the page.
Permissions and Roles
Access to the Transaction Analytics module is controlled by the following permissions:
Transaction Analytics Module Access: Required for accessing the transaction analytics dashboard (ACL:
transaction_analytics)Analytics Read Permission: Needed to view metrics and charts (ACL:
transaction_analytics)Analytics Export Permission: Required for downloading transaction data (ACL:
transaction_analytics)