
Transaction Analytics
The Transaction Analytics module provides a comprehensive overview of your transaction and order processed through Juspay. This documentation will guide you through the various features and UI elements available on the dashboard. Following are the different components in Transactions Analytics:
Metrics
|
Metrics
|
Description
|
Formula
|
|---|---|---|
Orders Success Rate
| The percentage of orders that were successful
| (Successful Orders)/(Total Number of Orders for which transactions are created)
|
Success Orders
| Number of Successful Orders in the selected time period
| -
|
Orders With Transaction(s)
| Total Number of Orders for which Transaction is Created
| -
|
Processed Amount
| Sum total of amounts for orders where transaction is successful
| -
|
Average Ticket Size
| -
| (Processed Amount)/(Success Orders)
|
Conflicted Orders Rate
| The percentage of orders that became successful after 10 minutes of transaction initiation
| (Success Orders after 10minutes of transaction initiation)/(Total Number of Orders for which transactions are created)
|
New Orders
| Total Number of Orders where status = NEW
| -
|
New Order Rate
| The percentage of orders with status = NEW
| (New Orders)/(Total Number of Orders)
|
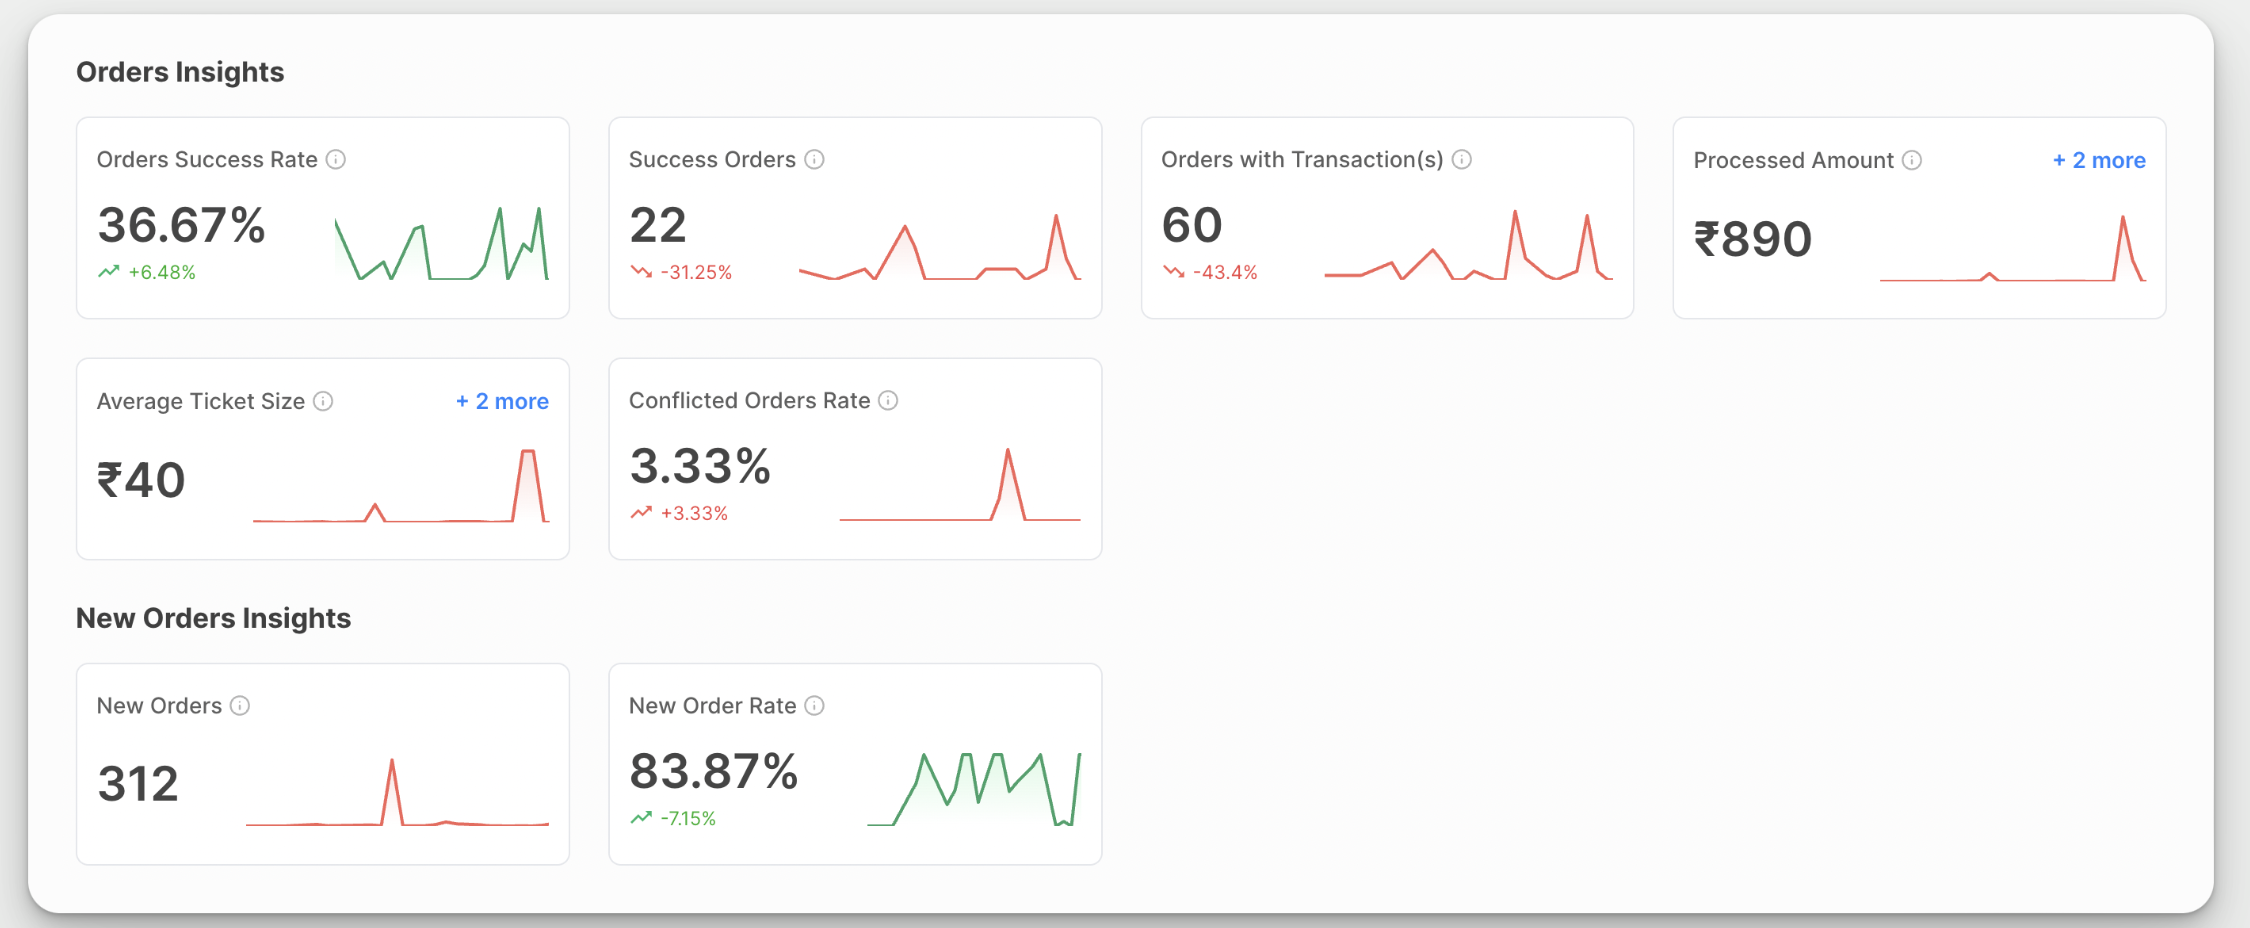
Charts
Juspay provides merchants with advanced analytics tools, featuring intuitive chart visualization that includes time-series data for payments.
Our segmentation feature enhances analysis by enabling users to dissect transaction data across various parameters and attributes
There are 2 dedicated charts where each of the above metric can be visualised as a time-series chart
.png)
Granularity and Top-N
Based on the time period selected, charts provide the ability to choose the time granularity for appropriate visualisation of the time series data. Eg if you choose granularity as 15 Minutes, the data would be broken into 15 minute windows and represented on the chart
|
Time Range of Data
|
Supported Granularity
|
|---|---|
1 day
| Hourly, 30 Minutes, 15 Minutes
|
1 day | Daily, Hourly
|
>7 Days
| Daily
|
In addition to granularity, charts also provide support to choose Top-5 or Top-10 values for a given segment or combination of segments
Segments
Segments are the different properties or attributes of the payments data, on which users can perform slice and dice of the above metrics
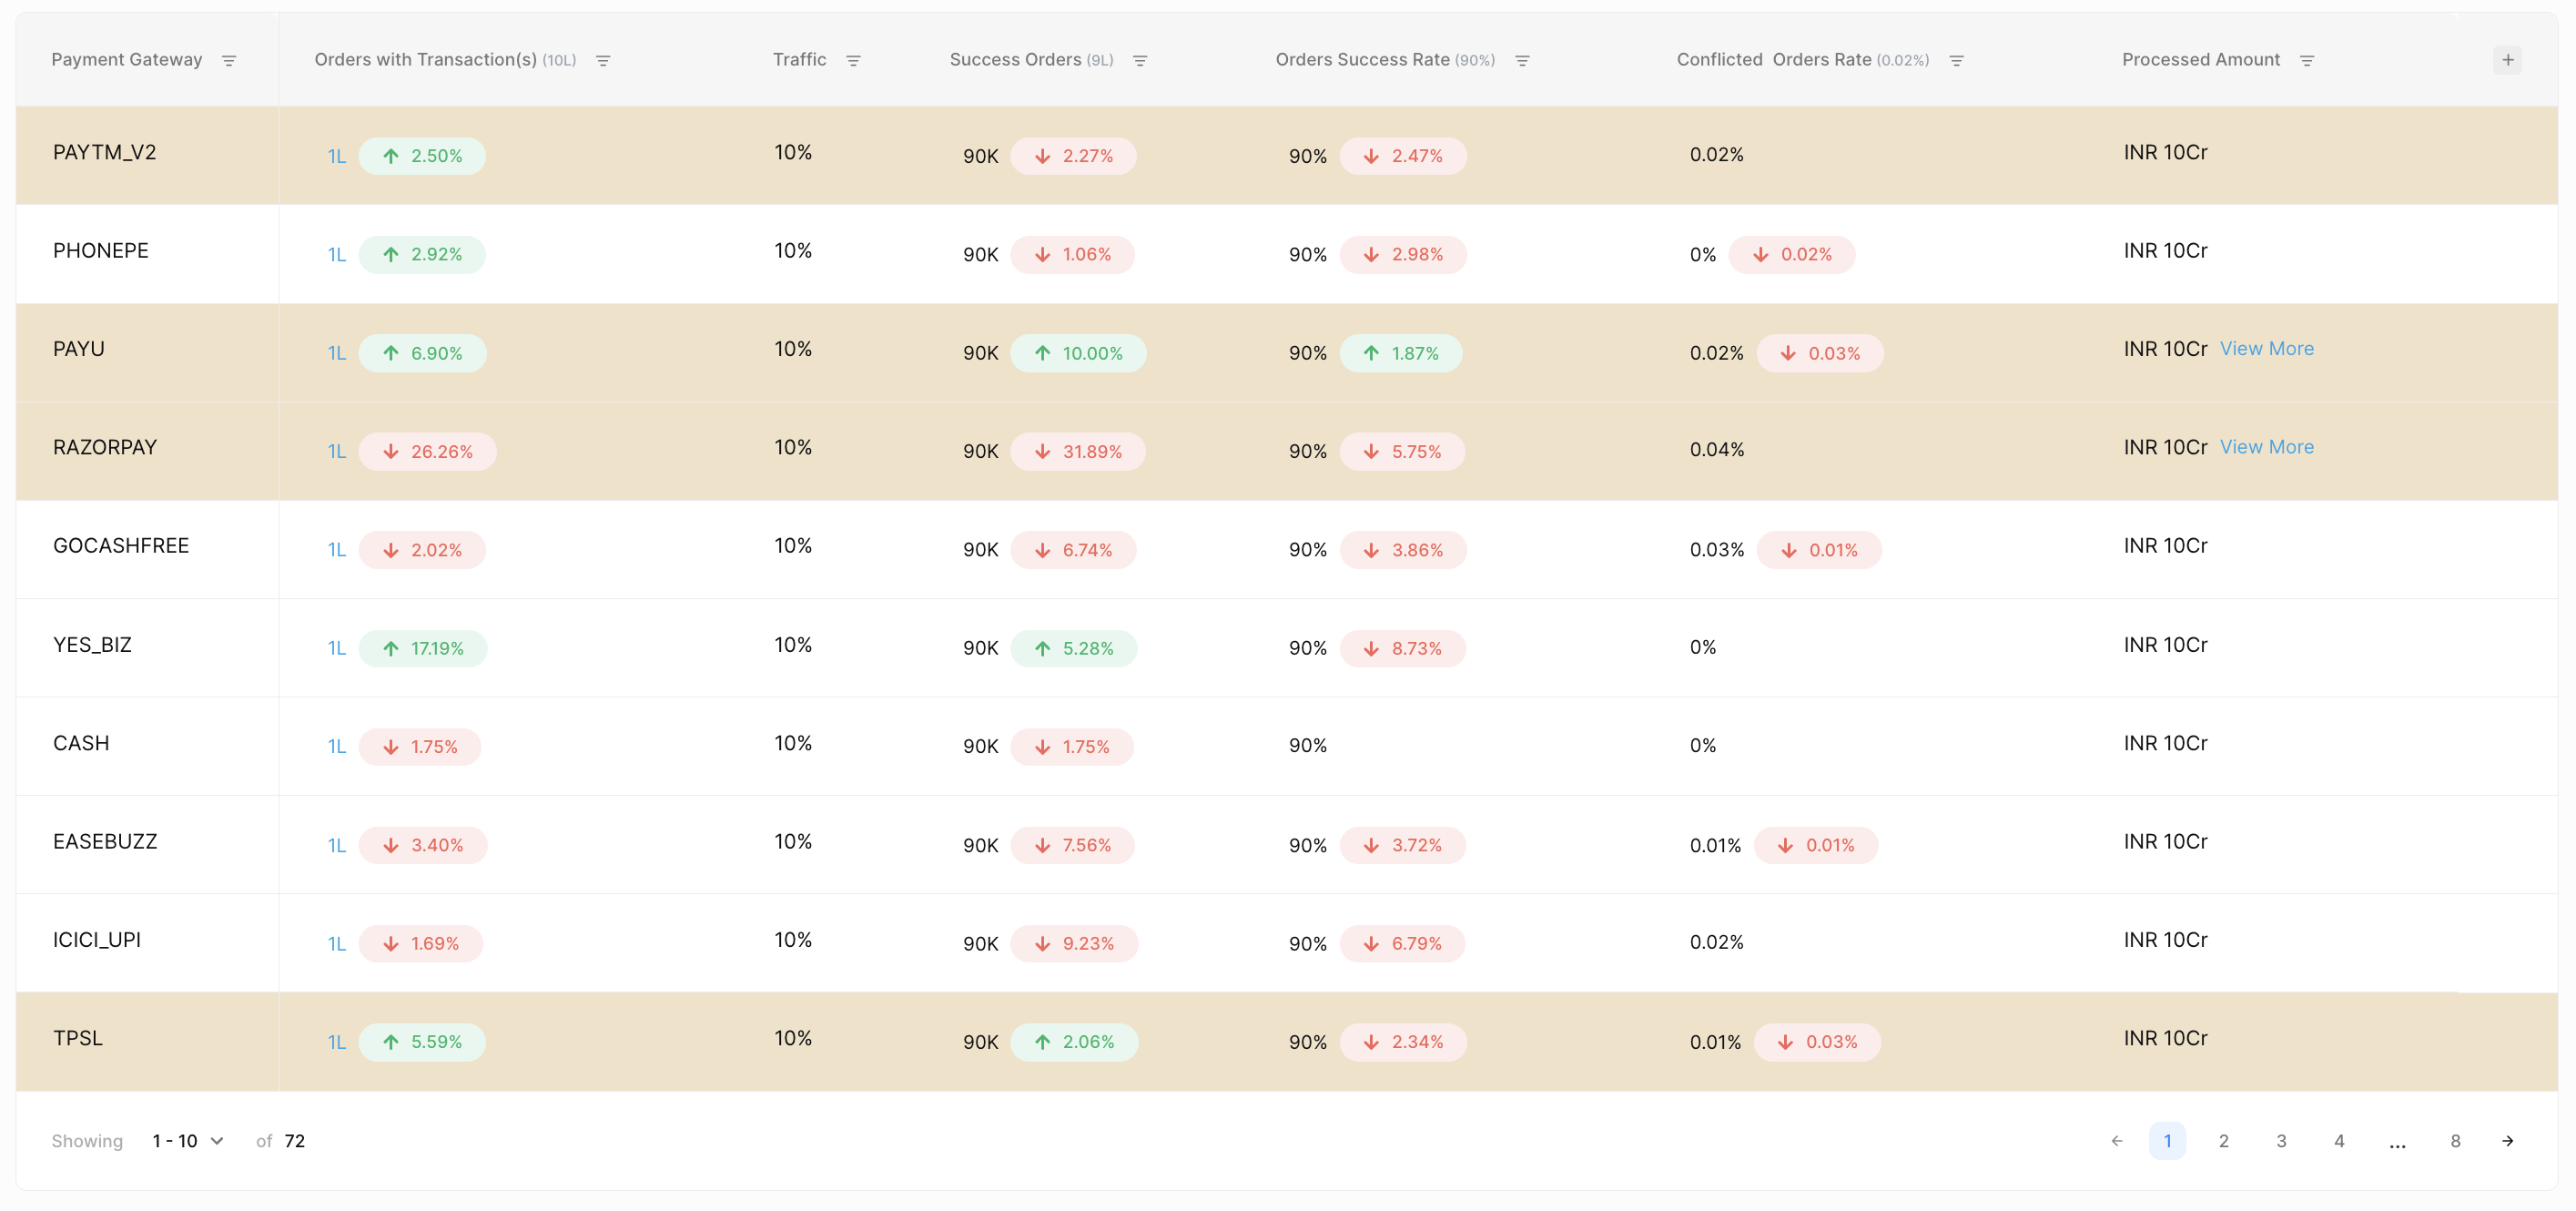
Summary Table
As the name suggests, summary table provides you a tabular representation of your payment metrics