

Offers Analytics
Overview
The Offers Analytics module provides comprehensive insights into offer performance and offer-related transactions within the Juspay payment platform. It offers real-time and historical analysis of offer effectiveness, success rates, benefit amounts, and detailed breakdowns across various business dimensions with multiple viewing modes for different analytical perspectives.
This module is designed for a wide range of users, including:
Operations Teams: For monitoring offer performance and identifying bottlenecks across different payment methods and offer campaigns.
Finance Teams: For tracking offer volumes, success rates, benefit amount analysis, and financial impact assessment of promotional campaigns.
Customer Support: To investigate offer-related issues, analyze customer behavior patterns with offers, and provide accurate status updates to customers.
Accessing the Module
Log in to the Juspay dashboard.
From the main navigation menu on the left, click on Analytics.
Select Offers Analytics from the Analytics submenu.
The navigation URL for this module is https://portal.juspay.in/analytics-offers.
Dashboard Overview
Viewing Modes
The Offers Analytics module offers two distinct viewing modes, each providing different analytical perspectives:
OFFER Mode (Default: kvoffers)
Purpose: Analyzes offers themselves and their performance
Use Case: Best for understanding offer effectiveness, benefit distribution, and offer campaign analysis
Data Granularity: One row per offer in downloads
Metrics Focus: Offer success rates, benefit amounts, offer application patterns
Time Column: Uses
offer_date_createdfor time-based analysis
OFFERTXN Mode (Default: kvofferstxn)
Purpose: Analyzes transactions that have offers applied
Use Case: Ideal for investigating transaction success rates when offers are involved, payment method performance with offers
Data Granularity: One row per transaction with offer context in downloads
Metrics Focus: Transaction success rates with offers, GMV through offer transactions, offer availed rates
Time Column: Uses
txn_initiatedfor time-based analysis
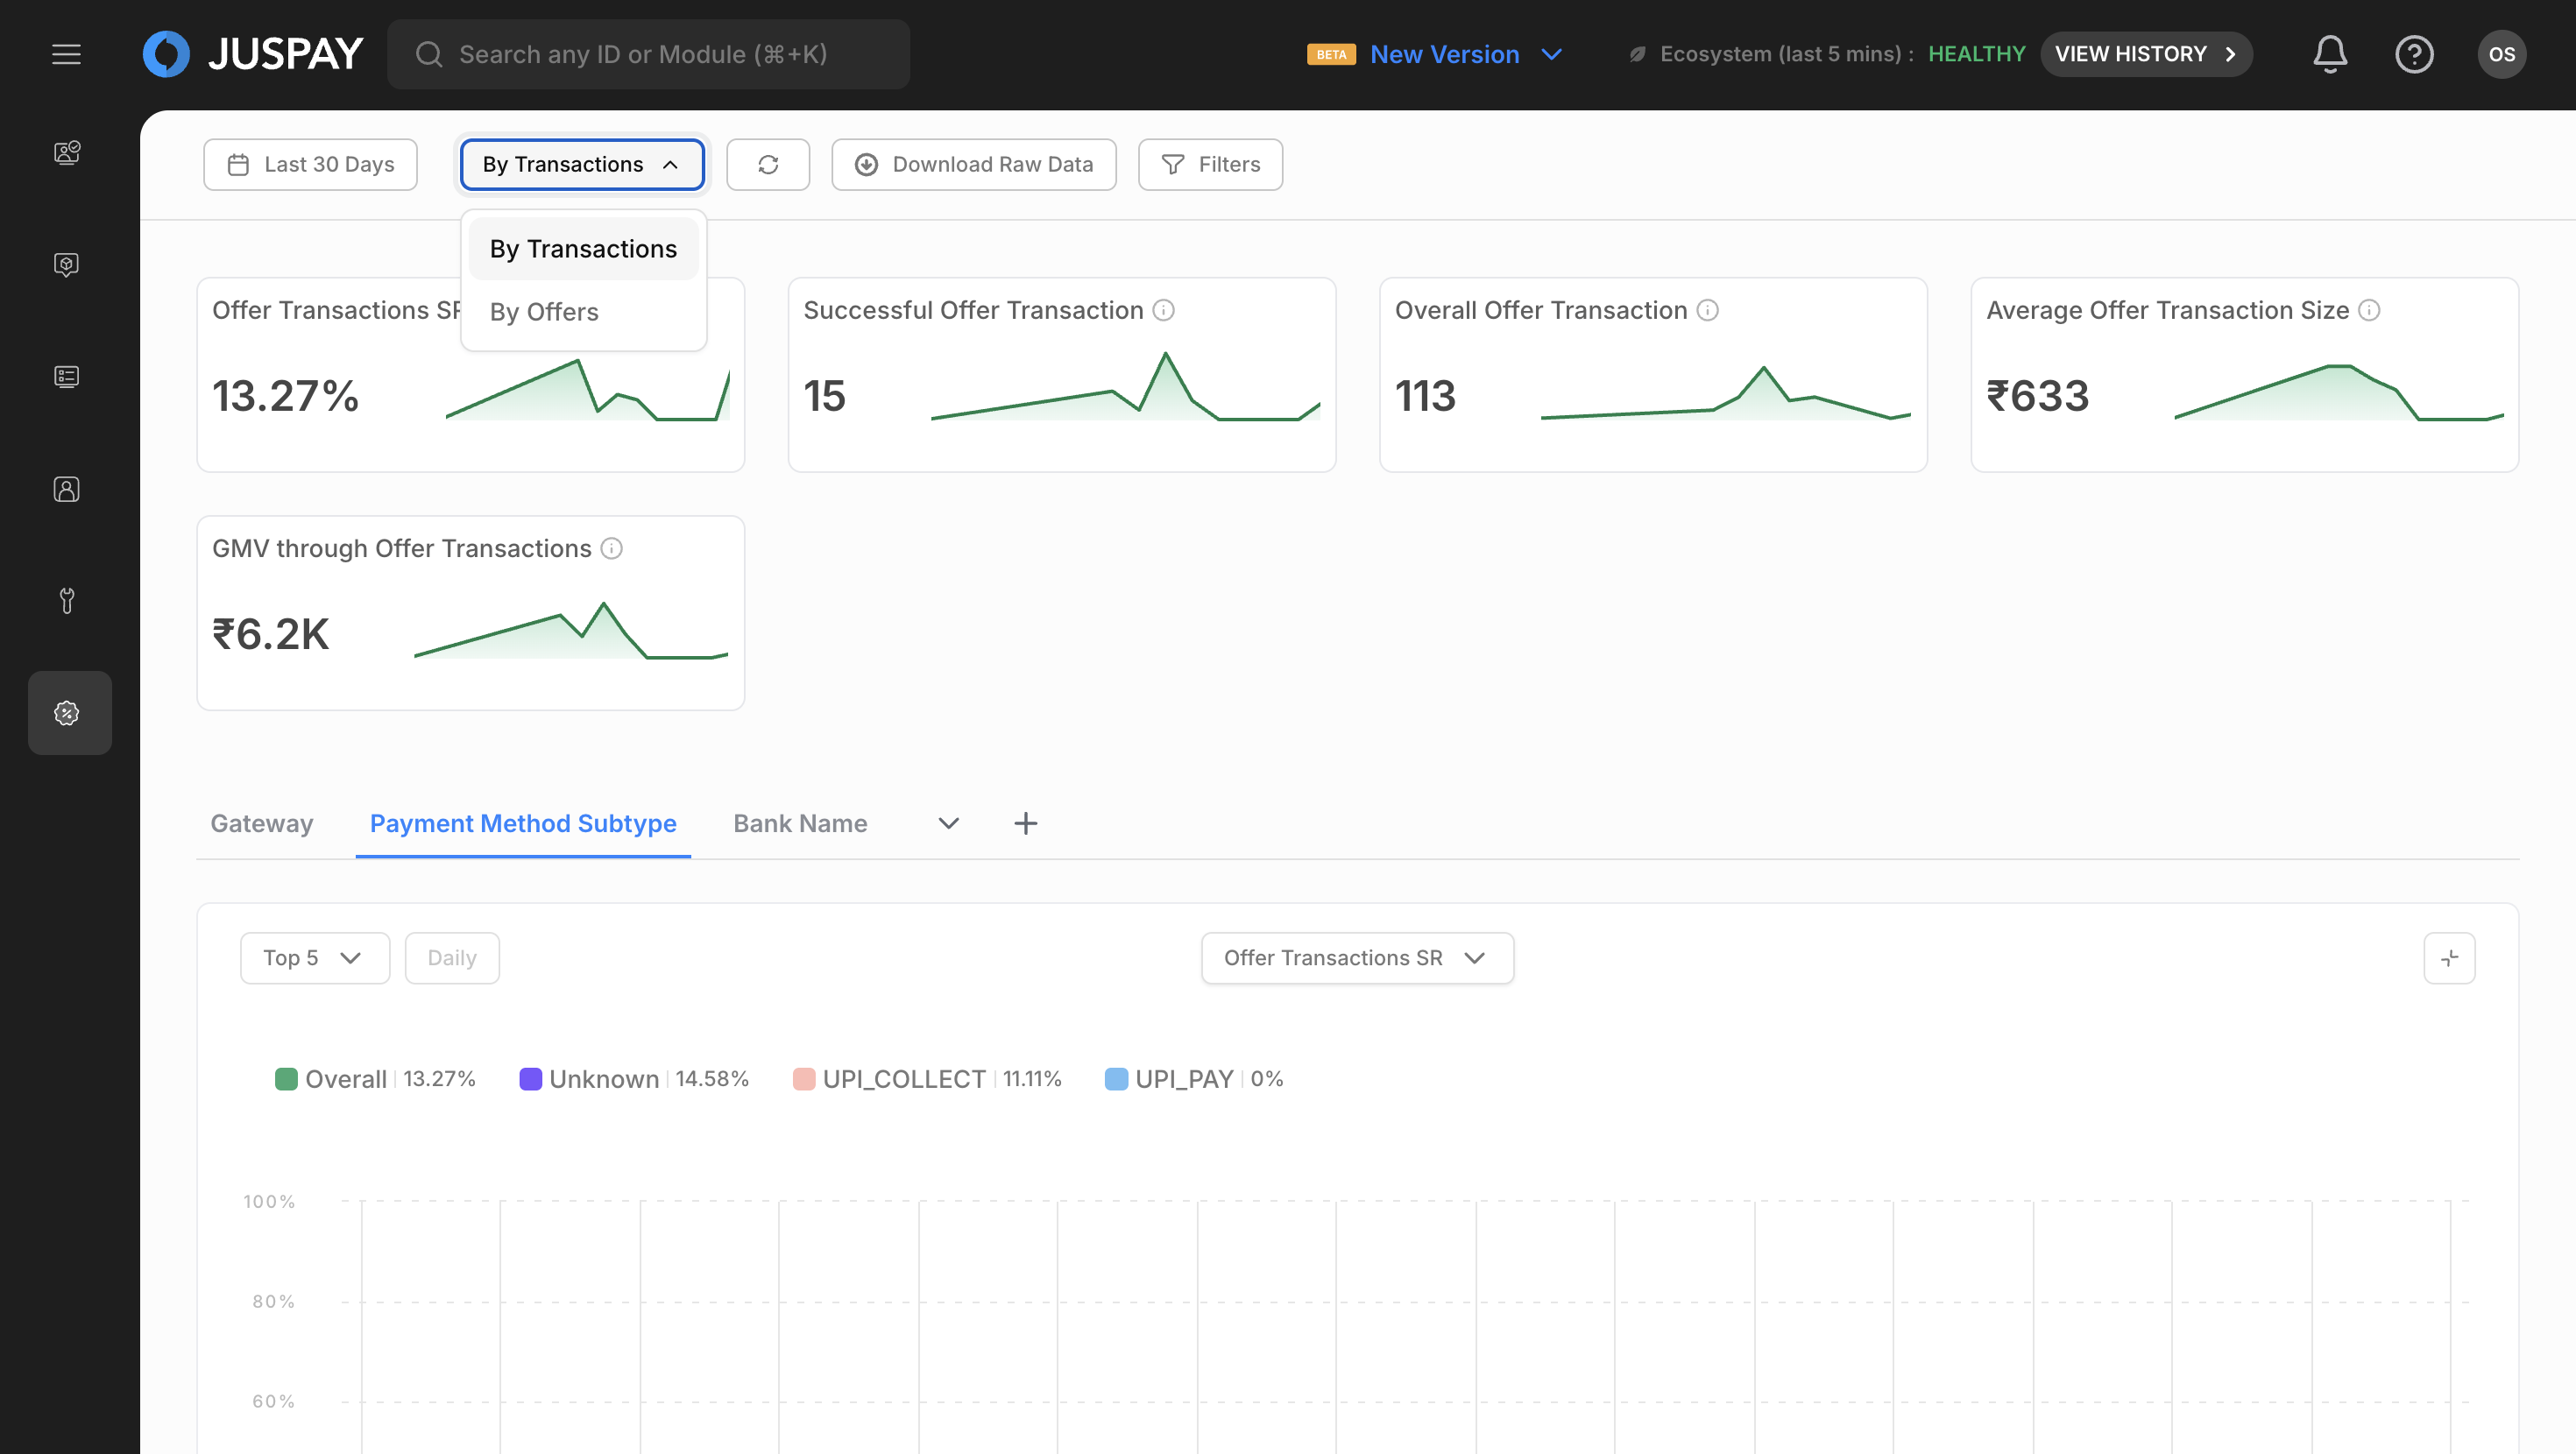
Key Performance Metrics
The dashboard displays essential offer performance indicators at the top, varying by selected mode:
OFFER Mode Metrics:
Offer Success Rate: Percentage of successful offers availed over total offers applied
Success Offers: Total successful offers availed in the selected time period
Overall Offers: Total offers applied
Offer Benefit Amount: Total benefit amount availed successfully through offers
Average Offer Size: Average benefit amount considering total number of availed offers
OFFERTXN Mode Metrics:
Offer Transactions SR: Percentage of successful transactions over total transactions with offers applied
Successful Offer Transaction: Successful transactions with offers availed in the selected time period
Overall Offer Transaction: Total transactions with offers applied
Offer Availed Rate: Successful transactions with offers availed over total successful transactions (requires Transaction Analytics ACL)
Average Offer Transaction Size: Average amount processed considering total number of transactions with offers availed
GMV through Offer Transactions: Total amount processed successfully with offers availed
Time Range Selection
Use the date picker to select your desired time range for analysis.
The system automatically rounds times to 5-minute intervals for consistency and performance.
Choose from predefined ranges or set custom date ranges.
Click Apply to refresh all metrics and charts with the new time range.
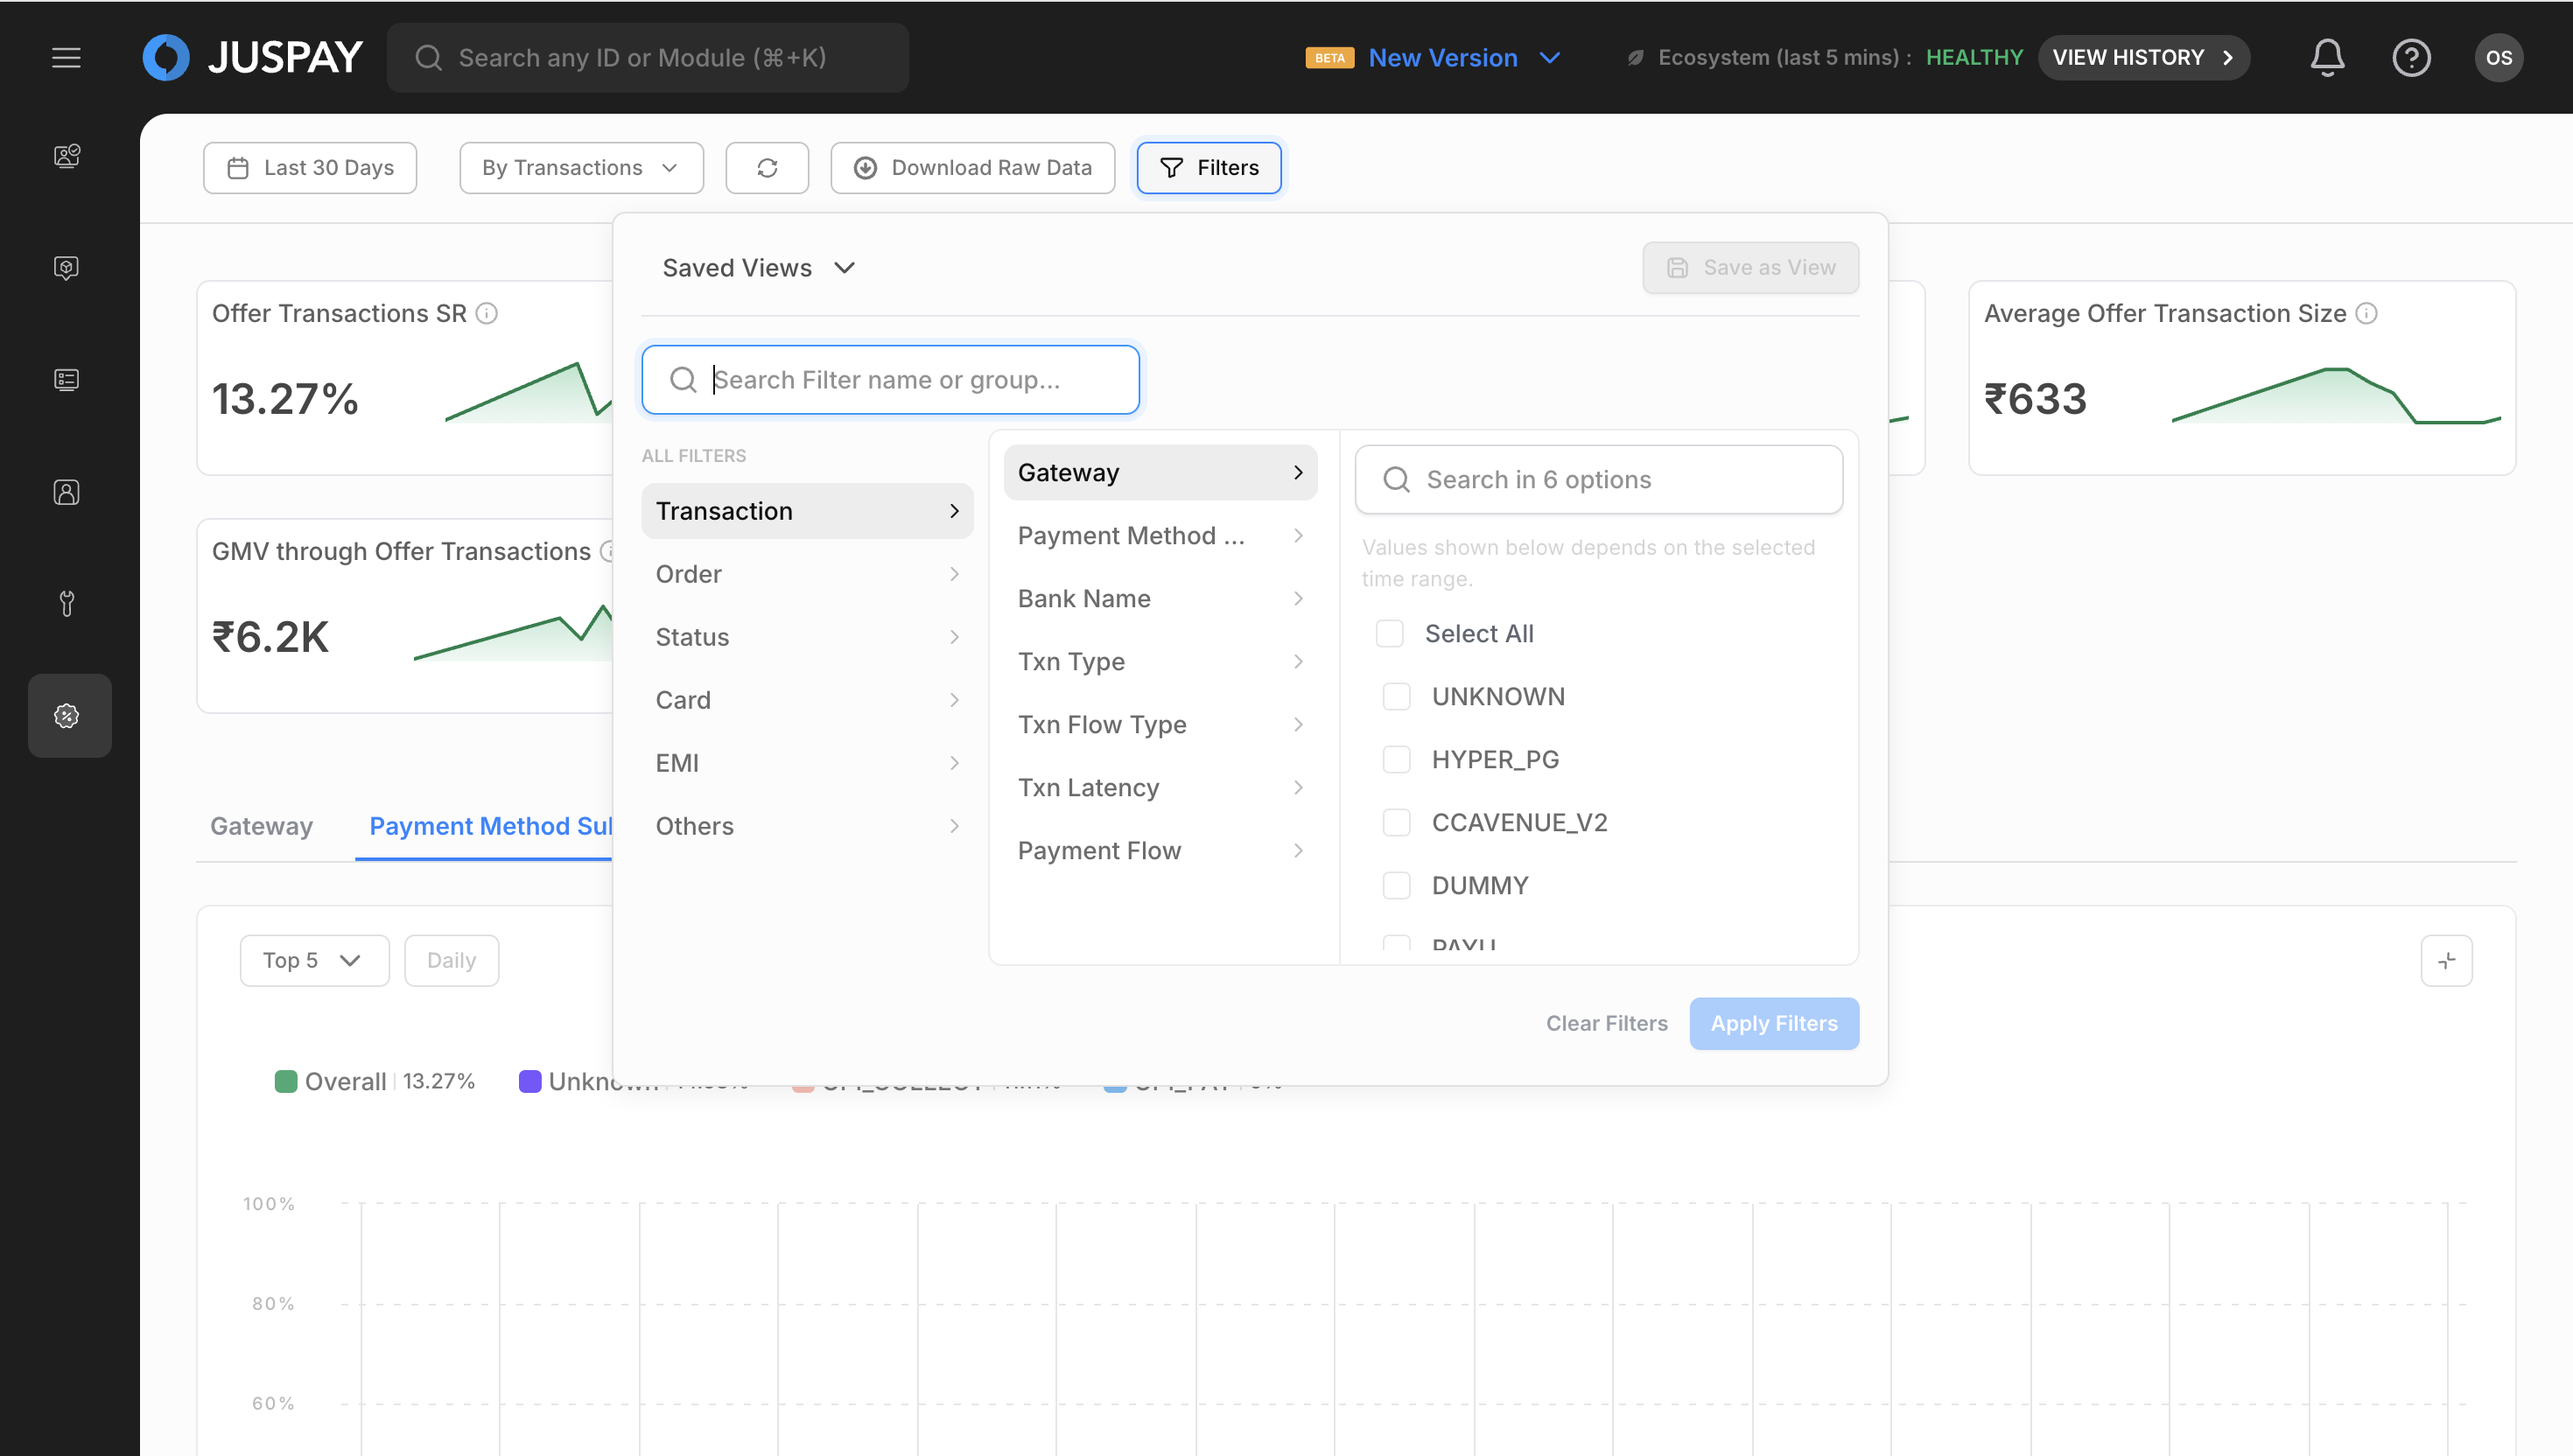
Filtering and Segmentation
Fixed Filters (Always Available)
Date Filter
Purpose: Select time range for offer analysis
Options: Predefined ranges (Today, Last 7 days, Last 30 days, etc.) or custom date selection
Time Rounding: Automatic rounding to 5-minute intervals for performance
Mode Filter
Purpose: Switch between OFFER and OFFERTXN analysis modes
Options: OFFER (Offer Level), OFFERTXN (Offer Transaction Level)
Dynamic Content: Available segments and metrics change based on selected mode
Default Selection: OFFERTXN mode when no specific mode is selected
Sync Filter
Purpose: Manual data synchronization
Usage: Click to refresh all dashboard data manually
Dynamic Segments
Dynamic segments are loaded based on the selected viewing mode and provide powerful filtering capabilities:
Segment Characteristics
Mode-Dependent: Available segments vary by OFFER/OFFERTXN mode
Searchable: Use search functionality to quickly find specific segments
Multi-Selection: Select up to 3 segments simultaneously (limited to 1 when time comparison is enabled)
Applying Segments
Click on the "Add Segments" button to open the segment selection panel.
Search for specific segments using the search input placeholder "Search Segments".
Select segments by clicking on them (maximum 3 selections).
Remove segments by clicking the remove button on selected segments (segments beyond the first 3 are removable).
Segments are automatically applied and update the dashboard data.
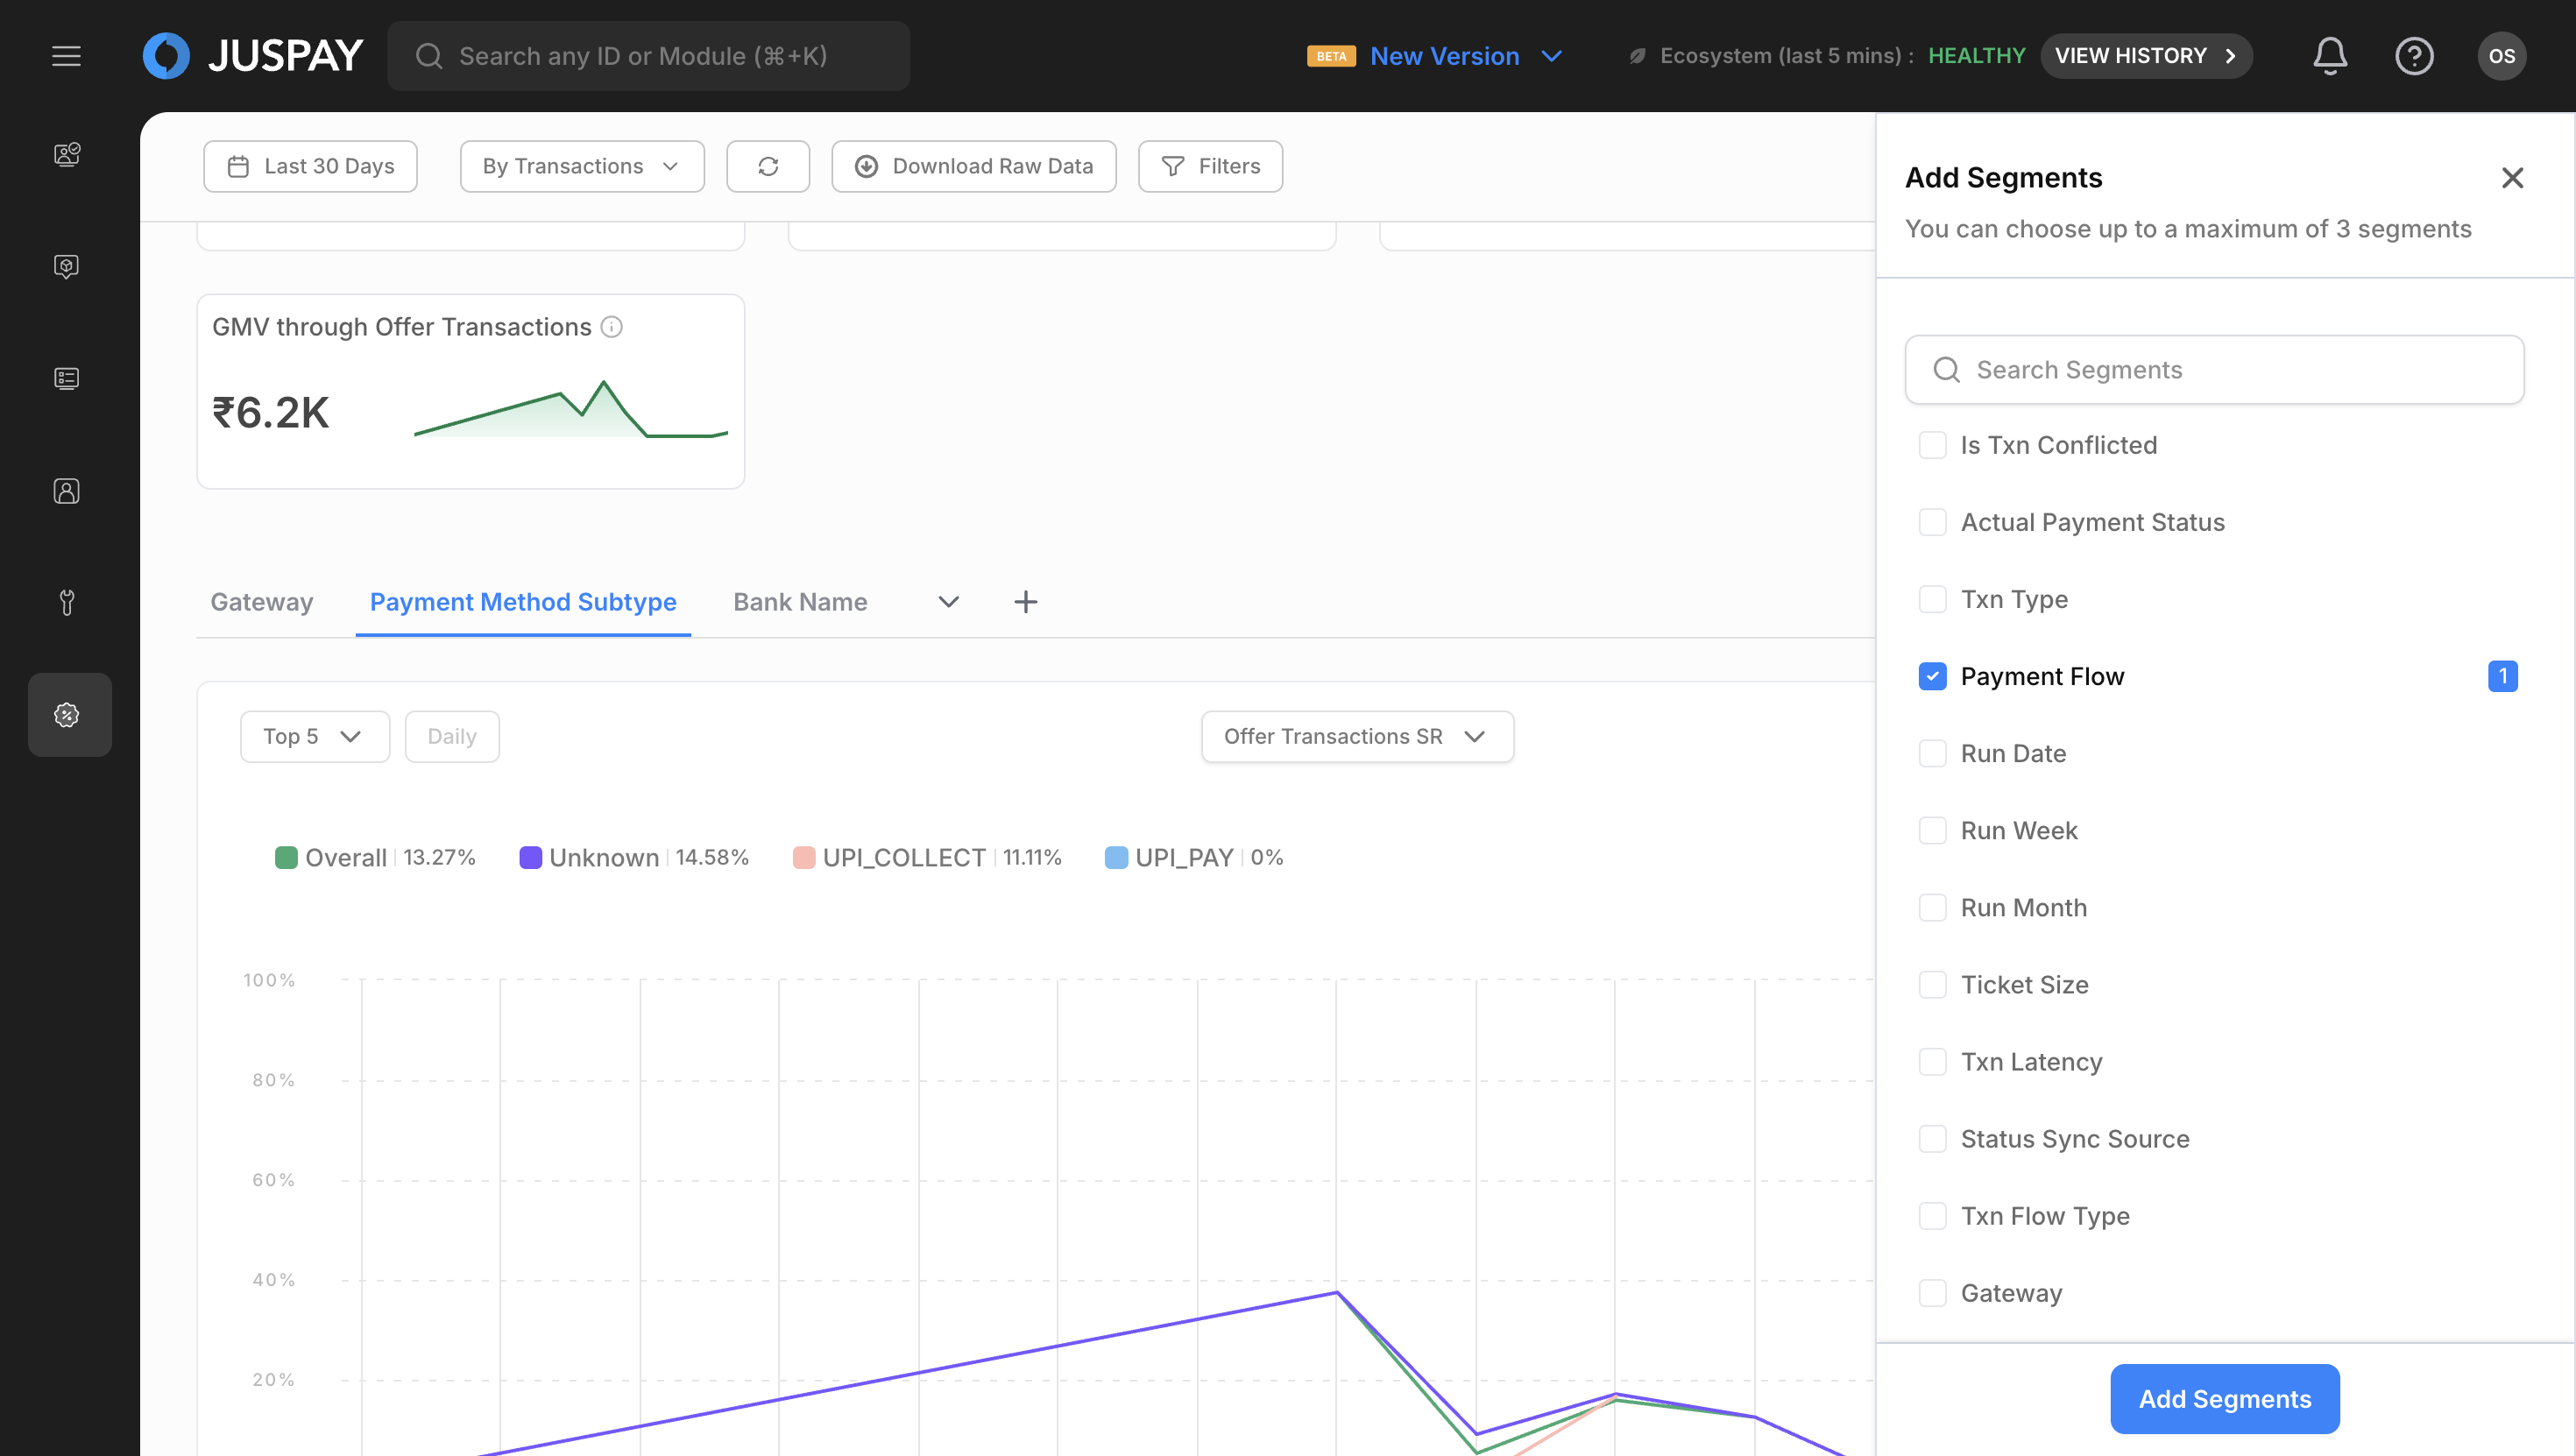
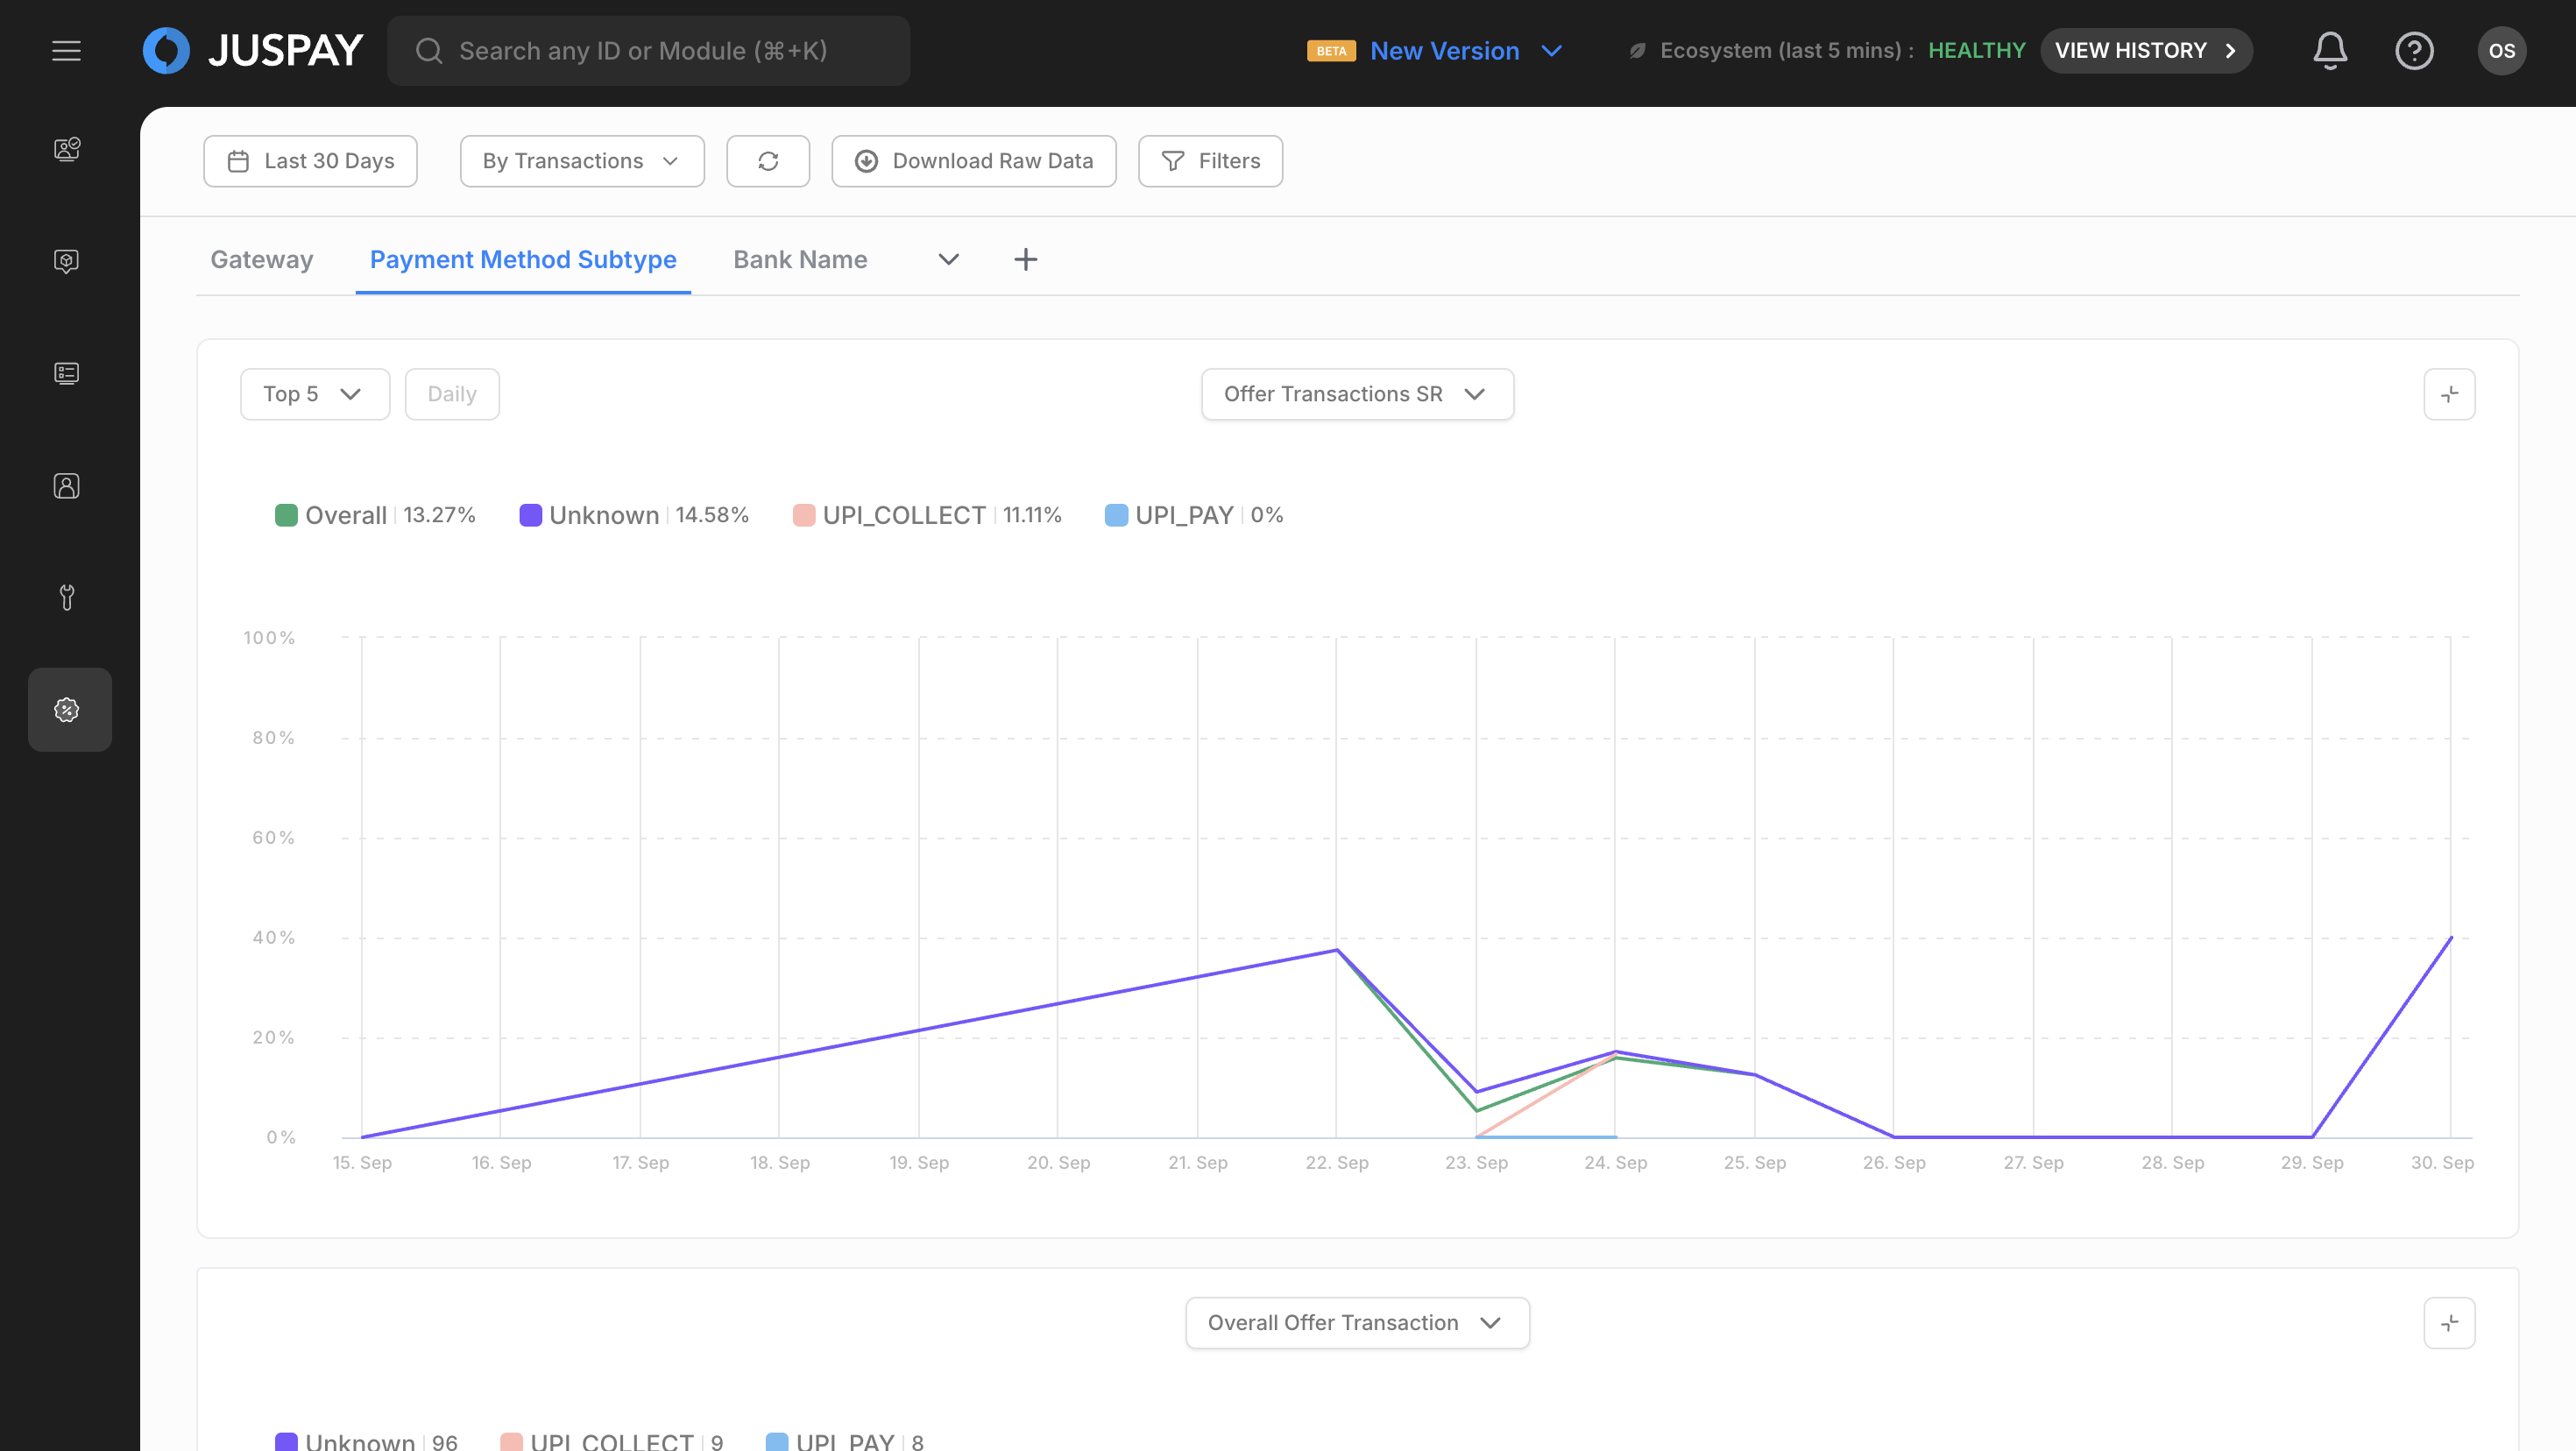
Chart Analytics
Creating and Viewing Charts
Chart Types Available
Time Series Charts: Interactive line charts showing offer trends over time
Multiple Metrics: Select multiple metrics for comparison across different dimensions
Chart Interactions
Hover over data points to see detailed offer information and tooltips.
Zoom and Pan: Use mouse or touch gestures to zoom into specific time periods.
Legend Toggle: Click legend items to show/hide specific data series.
Chart Features
Time Comparison
Period Comparison: Compare current period with previous period
Delta Calculations: Show changes between periods with color coding
Visual Indicators: Green for positive changes, red for negative changes
Table Integration: Delta columns appear in summary tables when time comparison is active
Chart Configuration Options
Cardinality Options: Top 5, Top 10 for segment-based analysis
Granularity Options: One Day, One Hour for time-based granularity
Default Sorting: Total Volume for consistent ordering
Time Threshold: 2.0 step-up threshold for amount metrics
Available Chart Metrics
OFFER Mode Charts
Offer Success Rate Chart
Primary Metric: Success Rate (Percentage)
Secondary Metric: Overall Offers (Volume)
Legend Options: Current, Overall
Chart Type: Time series
Success Offers Chart
Primary Metric: Success Offers (Volume)
Secondary Metric: Overall Offers (Volume)
Legend Options: Average, Overall
Chart Type: Time series
Overall Offers Chart
Primary Metric: Overall Offers (Volume)
Secondary Metric: Offer Success Rate (Percentage)
Legend Options: Average, Overall
Chart Type: Time series
Offer Benefit Amount Chart
Primary Metric: Offer Benefit Amount (Currency)
Secondary Metric: Overall Offers (Volume)
Legend Options: Average, Overall
Chart Type: Time series
Status: Disabled by default
Requirement: Select currency segment to view
Average Offer Size Chart
Primary Metric: Average Offer Size (Currency)
Secondary Metric: Overall Offers (Volume)
Legend Options: Average, Overall
Chart Type: Time series
Status: Disabled by default
Requirement: Select currency segment to view
OFFERTXN Mode Charts
Offer Transactions SR Chart
Primary Metric: Offer Transactions Success Rate (Percentage)
Secondary Metric: Overall Offer Transaction (Volume)
Legend Options: Current, Overall
Chart Type: Time series
Successful Offer Transaction Chart
Primary Metric: Successful Offer Transaction (Volume)
Secondary Metric: Overall Offer Transaction (Volume)
Legend Options: Average, Overall
Chart Type: Time series
Overall Offer Transaction Chart
Primary Metric: Overall Offer Transaction (Volume)
Secondary Metric: Offer Transactions Success Rate (Percentage)
Legend Options: Average, Overall
Chart Type: Time series
Average Offer Transaction Size Chart
Primary Metric: Average Offer Transaction Size (Currency)
Secondary Metric: Overall Offer Transaction (Volume)
Legend Options: Average, Overall
Chart Type: Time series
Status: Disabled by default
Requirement: Select currency segment to view
GMV through Offer Transactions Chart
Primary Metric: GMV through Offer Transactions (Currency)
Secondary Metric: Overall Offer Transaction (Volume)
Legend Options: Average, Overall
Chart Type: Time series
Status: Disabled by default
Requirement: Select currency segment to view
Chart Customization
Chart Features
Advanced Interactions: Full zoom, pan, and selection capabilities
Detailed Tooltips: Comprehensive tooltip information with offer-specific details
Export Options: Chart export functionality
Analytics Table
Summary Tables
The analytics table provides comprehensive breakdowns of offer metrics across different segments
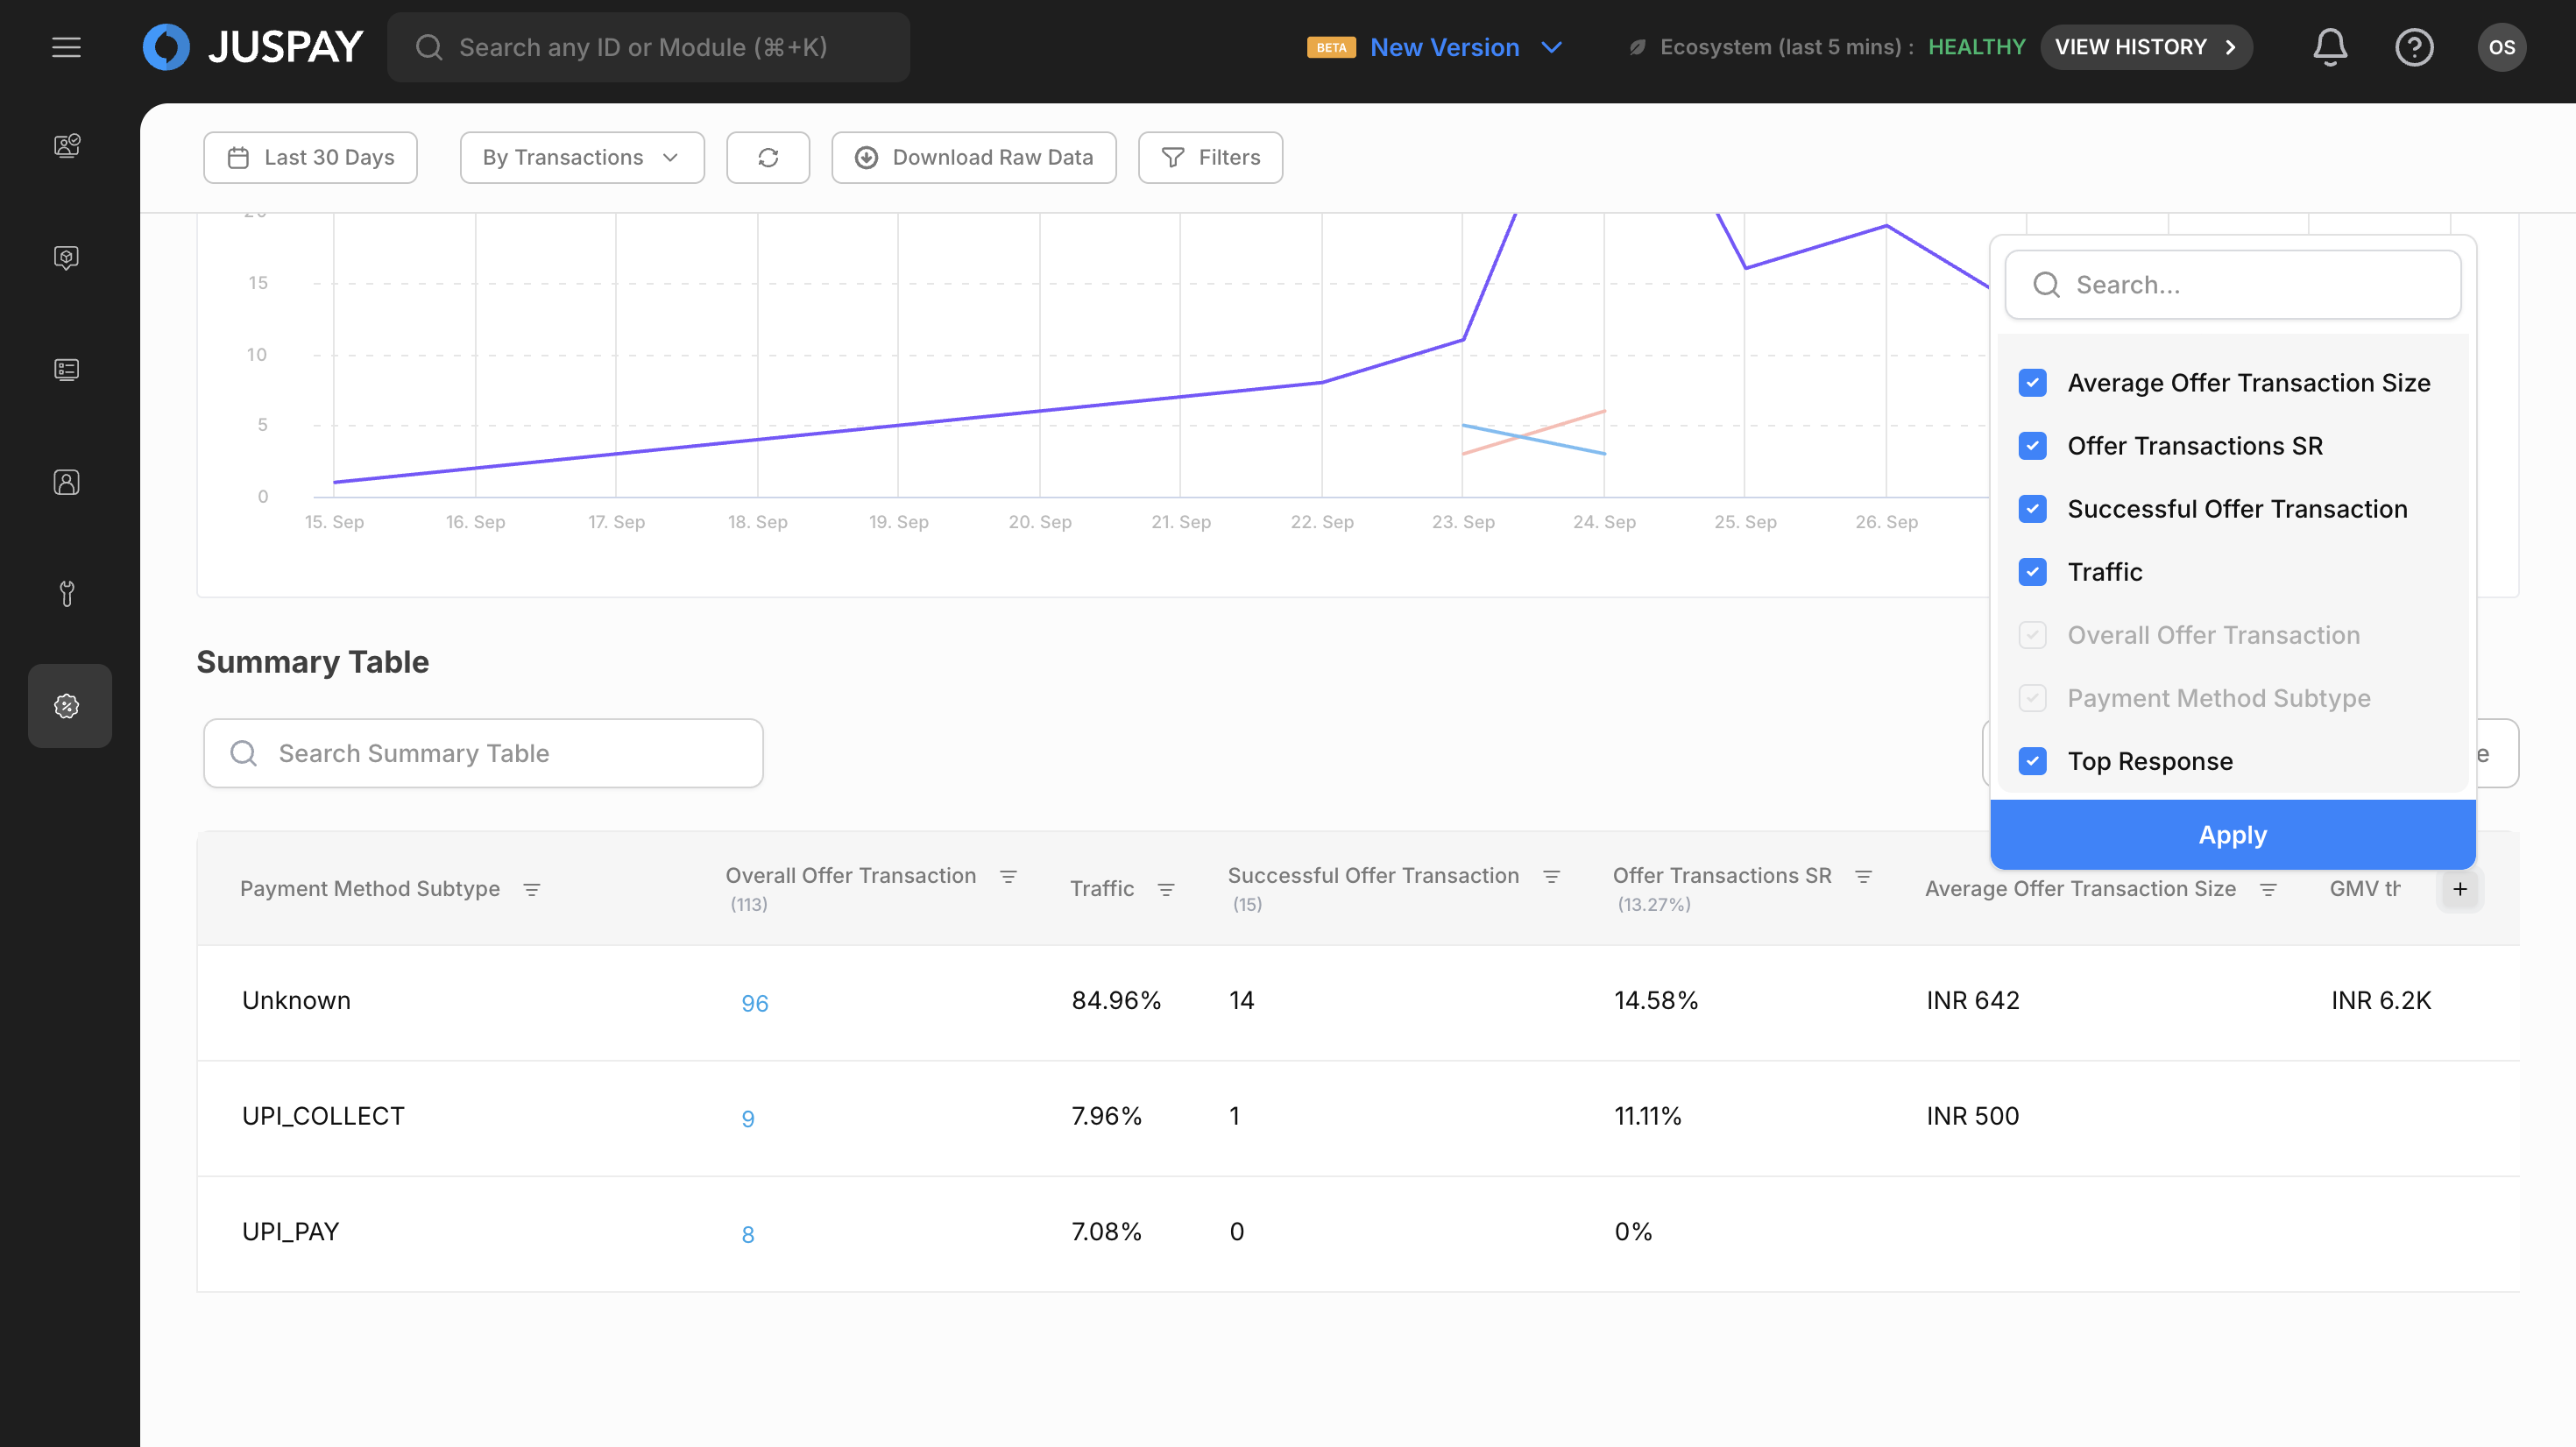
Table Structure
Default Columns (Both Modes)
Total Volume Column
Type: Volume Modal
Features:
Clickable for detailed breakdown
Delta comparison available
Default sorting column
Modal: Opens volume breakdown modal with domain-specific configuration
Traffic Column
Type: Percentage (2 decimal places)
Purpose: Shows traffic distribution
Header: Hidden
Note: Not a metrics column
Success Volume Column
Type: Numeric display
Features: Delta comparison available
Header: Visible
Success Rate Column
Type: Percentage (2 decimal places)
Features: Delta comparison available
Header: Visible
Mode-Specific Columns
OFFER Mode Additional Columns
Offer Benefit Amount
Type: Next-line amount display
Currency Support: Multi-currency
Modal: Currency breakdown modal available
Average Offer Size
Type: Next-line amount display
Currency Support: Multi-currency
Modal: Currency breakdown modal available
OFFERTXN Mode Additional Columns
Average Offer Transaction Size
Type: Next-line amount display
Currency Support: Multi-currency
Modal: Currency breakdown modal available
GMV through Offer Transactions
Type: Next-line amount display
Currency Support: Multi-currency
Modal: Currency breakdown modal available
Error Analysis Column (Both Modes)
Top Response Column
Type: Distribution Modal
Purpose: Error code and message analysis
Features:
No sorting or filtering
No column mapping
Not a metrics column
Modal Configuration:
Volume Column: total_volume
Group By: offererrorcode, offererrormessage (OFFER mode) / offererrorcode, error_message (OFFERTXN mode)
Filter: Excludes records where offer_status = "AVAILED"
Table Actions and Interactions
Volume Analysis
Click volume numbers to open detailed volume breakdown modals.
Analyze patterns using the detailed breakdown data.
Domain-specific configuration provides relevant breakdown based on current mode.
Performance Metrics
Success Rates: View offer success rates with trend indicators
Processing Times: Monitor offer processing across different scenarios
Error Analysis: Detailed error distribution and patterns for offer operations
Table Customization
Column Management
Click the "Choose Columns" button.
Select/deselect columns to customize your offer data view.
Sync and Refresh
Manual Refresh
Sync Button
Purpose: Manually refresh all dashboard data
Usage: Click the "Sync" button to get the most current offer data
When to Use: When you need immediate data updates or suspect data staleness
Visual Feedback: Loading indicators show refresh progress
Data Export
Download Capabilities
Export Table
Apply Filters: Set your desired time range and segments to filter the data in the summary table.
Click "Export Table": Use the "Export Table" button located in the top-right corner of the Summary Table section.
Download: The system will immediately download a CSV file containing all the data currently displayed in the table.
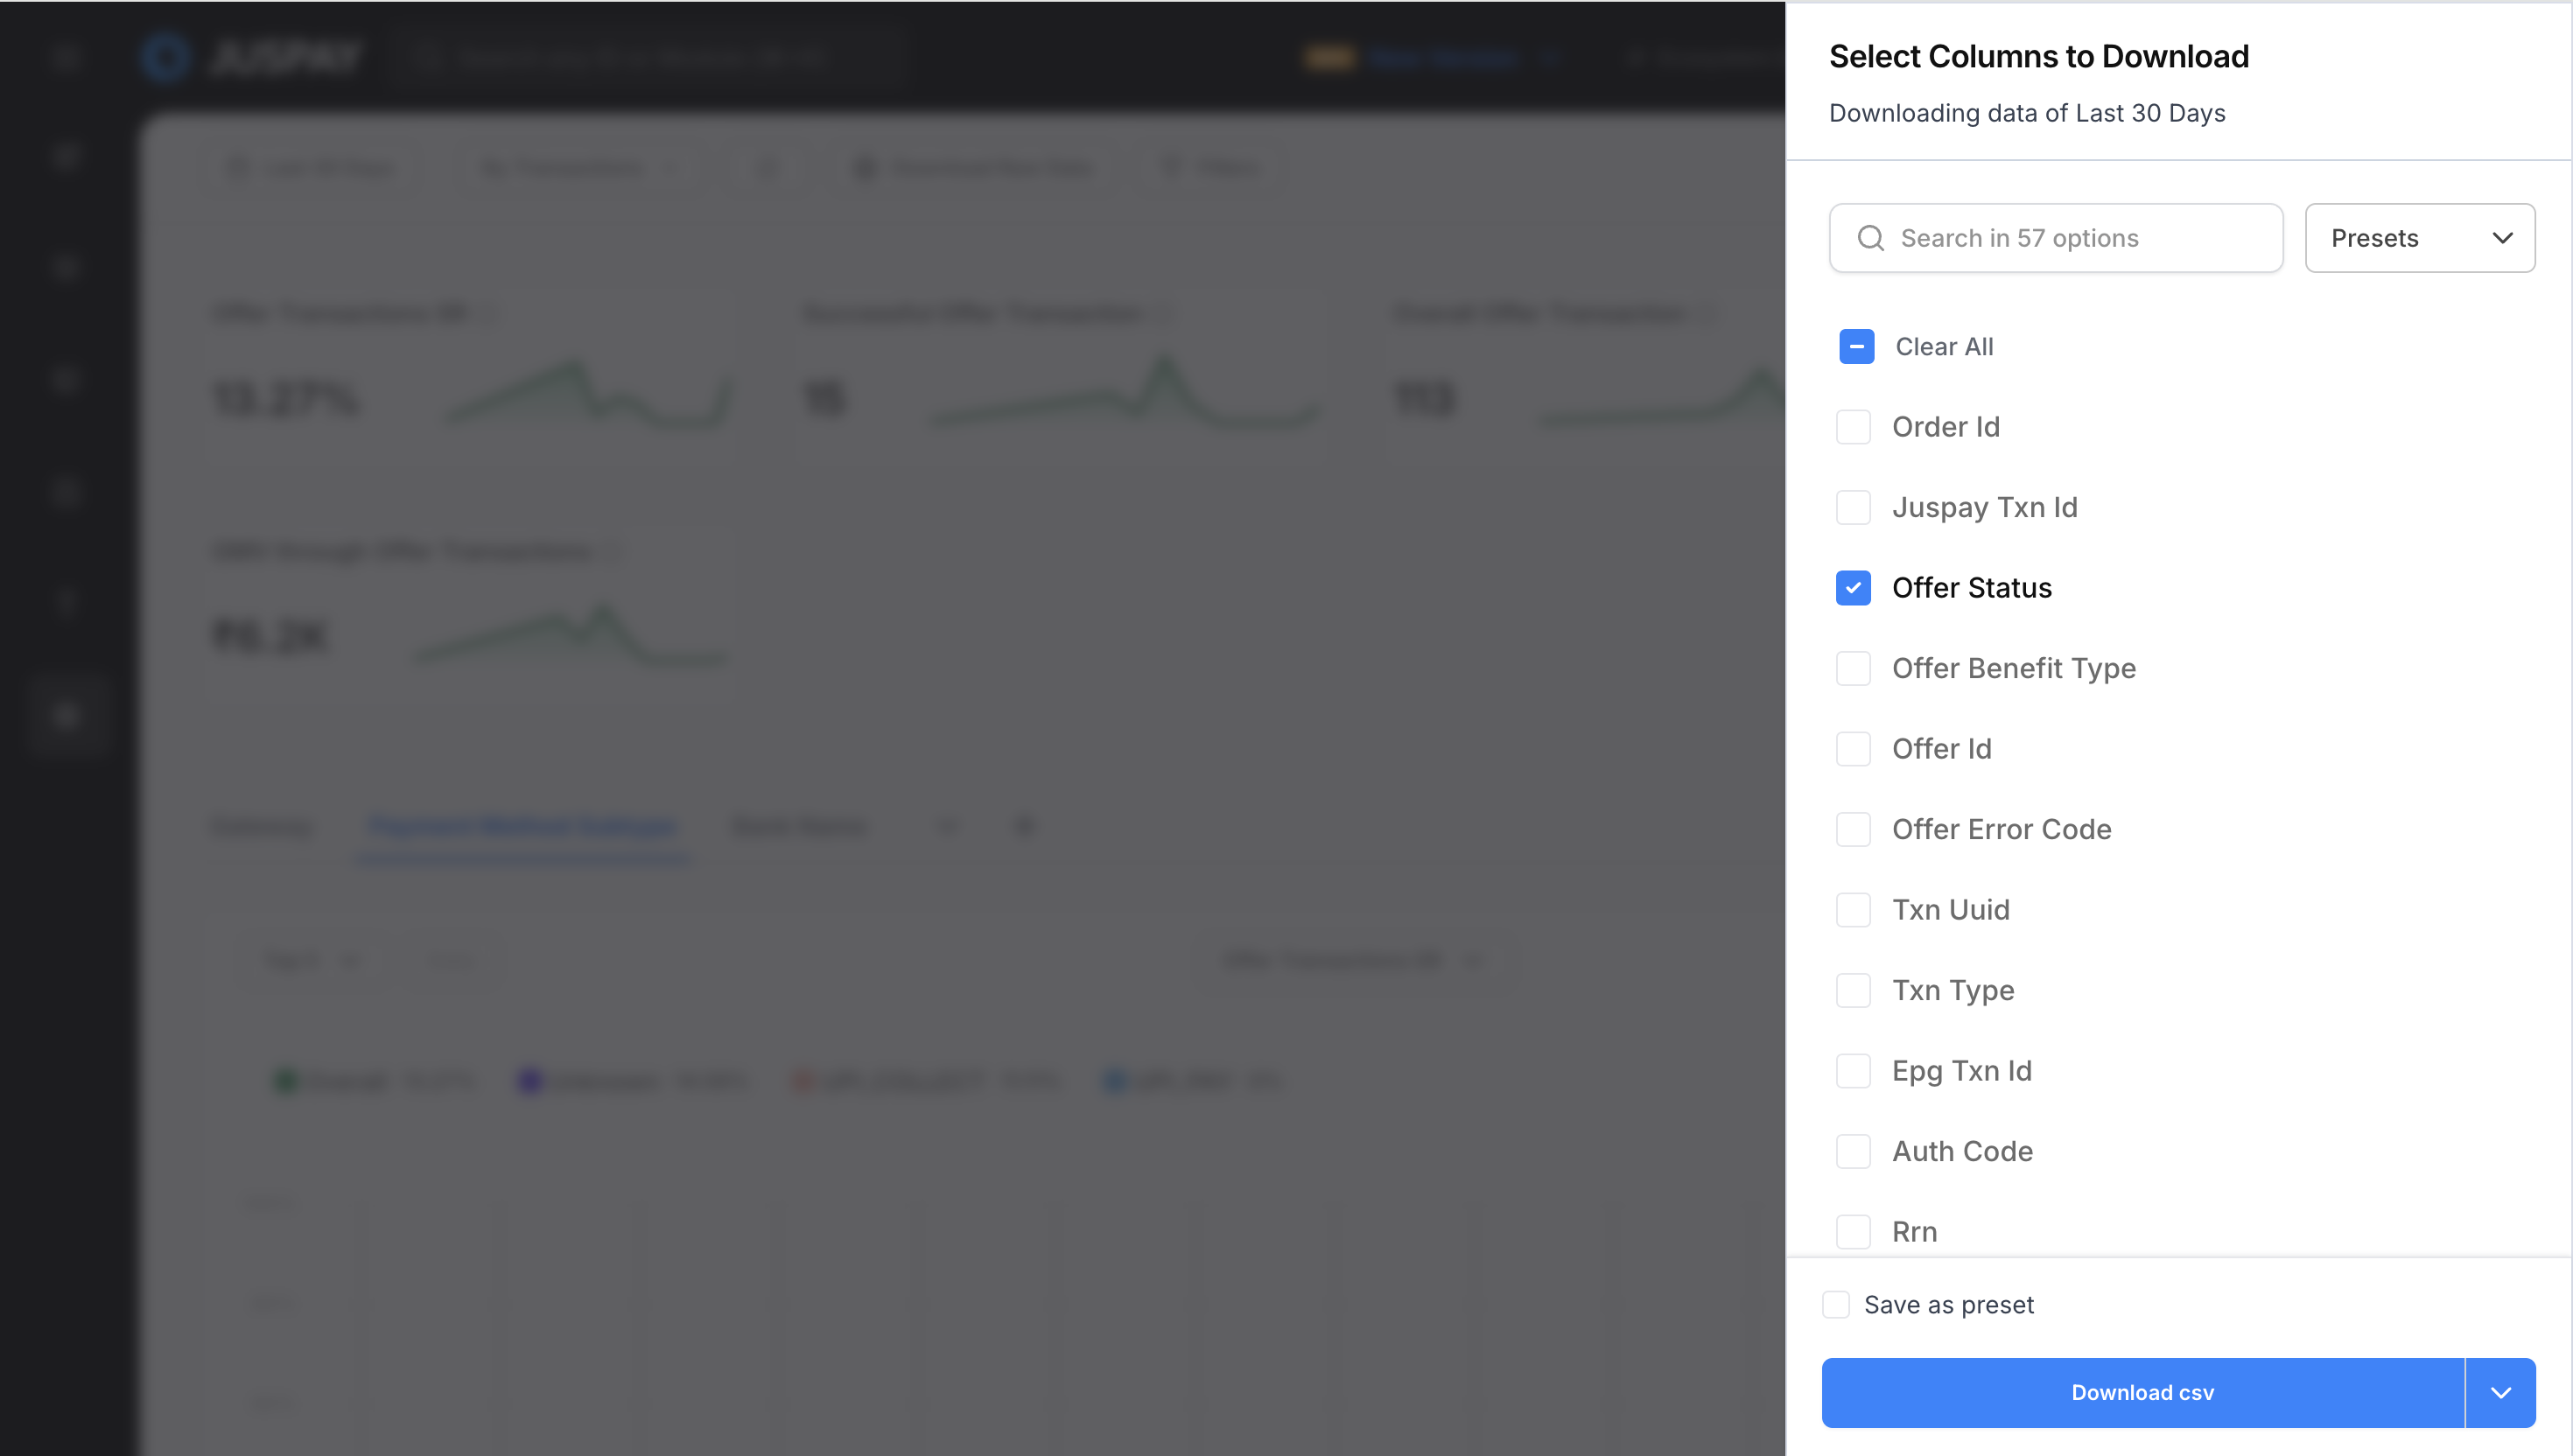
Download Field Selection with Presets
Preset Management:
Save as Preset: Save your current column selection as a named preset for future use
Use Saved Presets: Quickly apply previously saved column selections from the presets dropdown
Update Presets: Modify existing presets when you change column selections
Remove Presets: Delete presets you no longer need using the trash icon
Auto-Selection: The system automatically selects the most recently used preset when opening the download modal
Use Cases
Real-Time Offer Performance Monitoring
Set OFFERTXN mode, last 1-6 hours time range
Monitor Offer Transactions SR and Offer Availed Rate metrics
Add payment_method_type segment
Offer Campaign Effectiveness Analysis
Set OFFER mode for offer-level analysis
Apply offer_id or offer_type segments
Compare Offer Success Rate, Benefit Amounts, Average Offer Size
Use charts for trend visualization
Monthly Financial Impact Assessment
Set OFFERTXN mode, previous month time range
Monitor GMV through Offer Transactions across currencies
Add currency segment
Use time comparison with previous month
Permissions and Roles
Access to the Offers Analytics module is controlled by the following permissions:
Transaction Analytics Module Access: Required for accessing the offers analytics dashboard (ACL:
transaction_analytics)Analytics Read Permission: Needed to view offer metrics and charts (ACL:
transaction_analytics)Analytics Export Permission: Required for downloading offer data (ACL:
transaction_analytics)